Sustainability is not just about some limited area of concern–our environment, for example–but in fact encompasses the world as we know it, both internal and external. It is, then, a way of thinking about the world more holistically with an understanding about how one piece of the puzzle naturally affects the entire picture. As I typed that last sentence, I noted a metaphor that emerged that might guide our understanding: the world-as-puzzle metaphor. What does such an image suggest about how we approach sustainability as an idea and as a social calling? What do other ways of visualizing sustainability suggest about what lies at the “heart” of sustainability?
Let’s talk about this one first as a class:

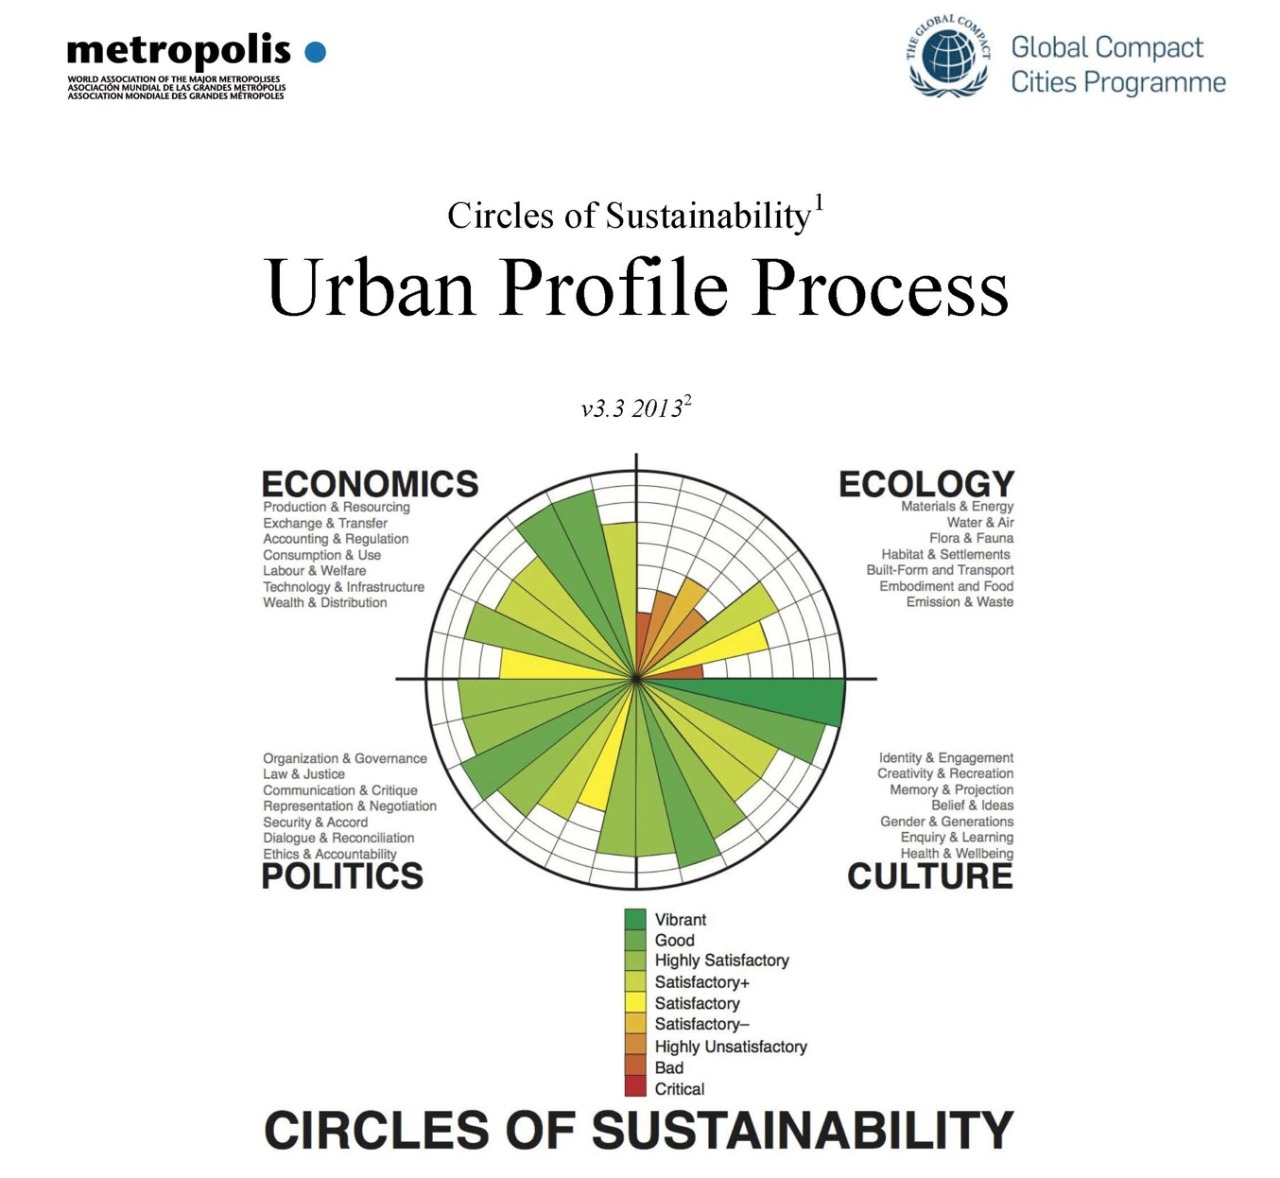
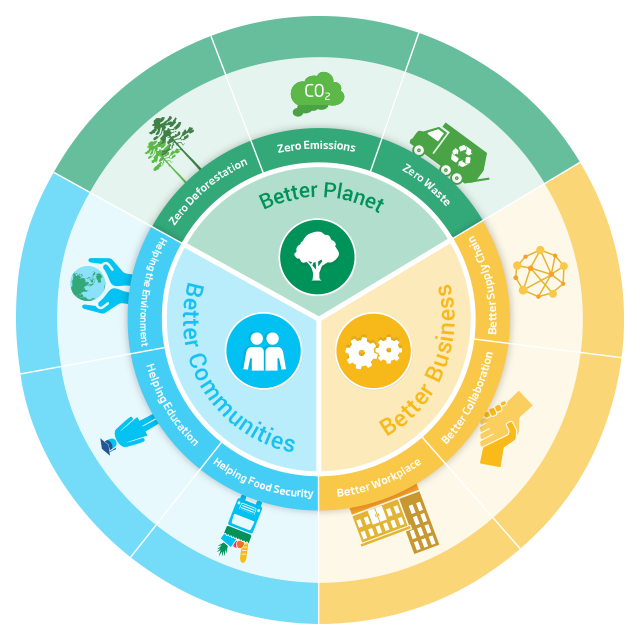
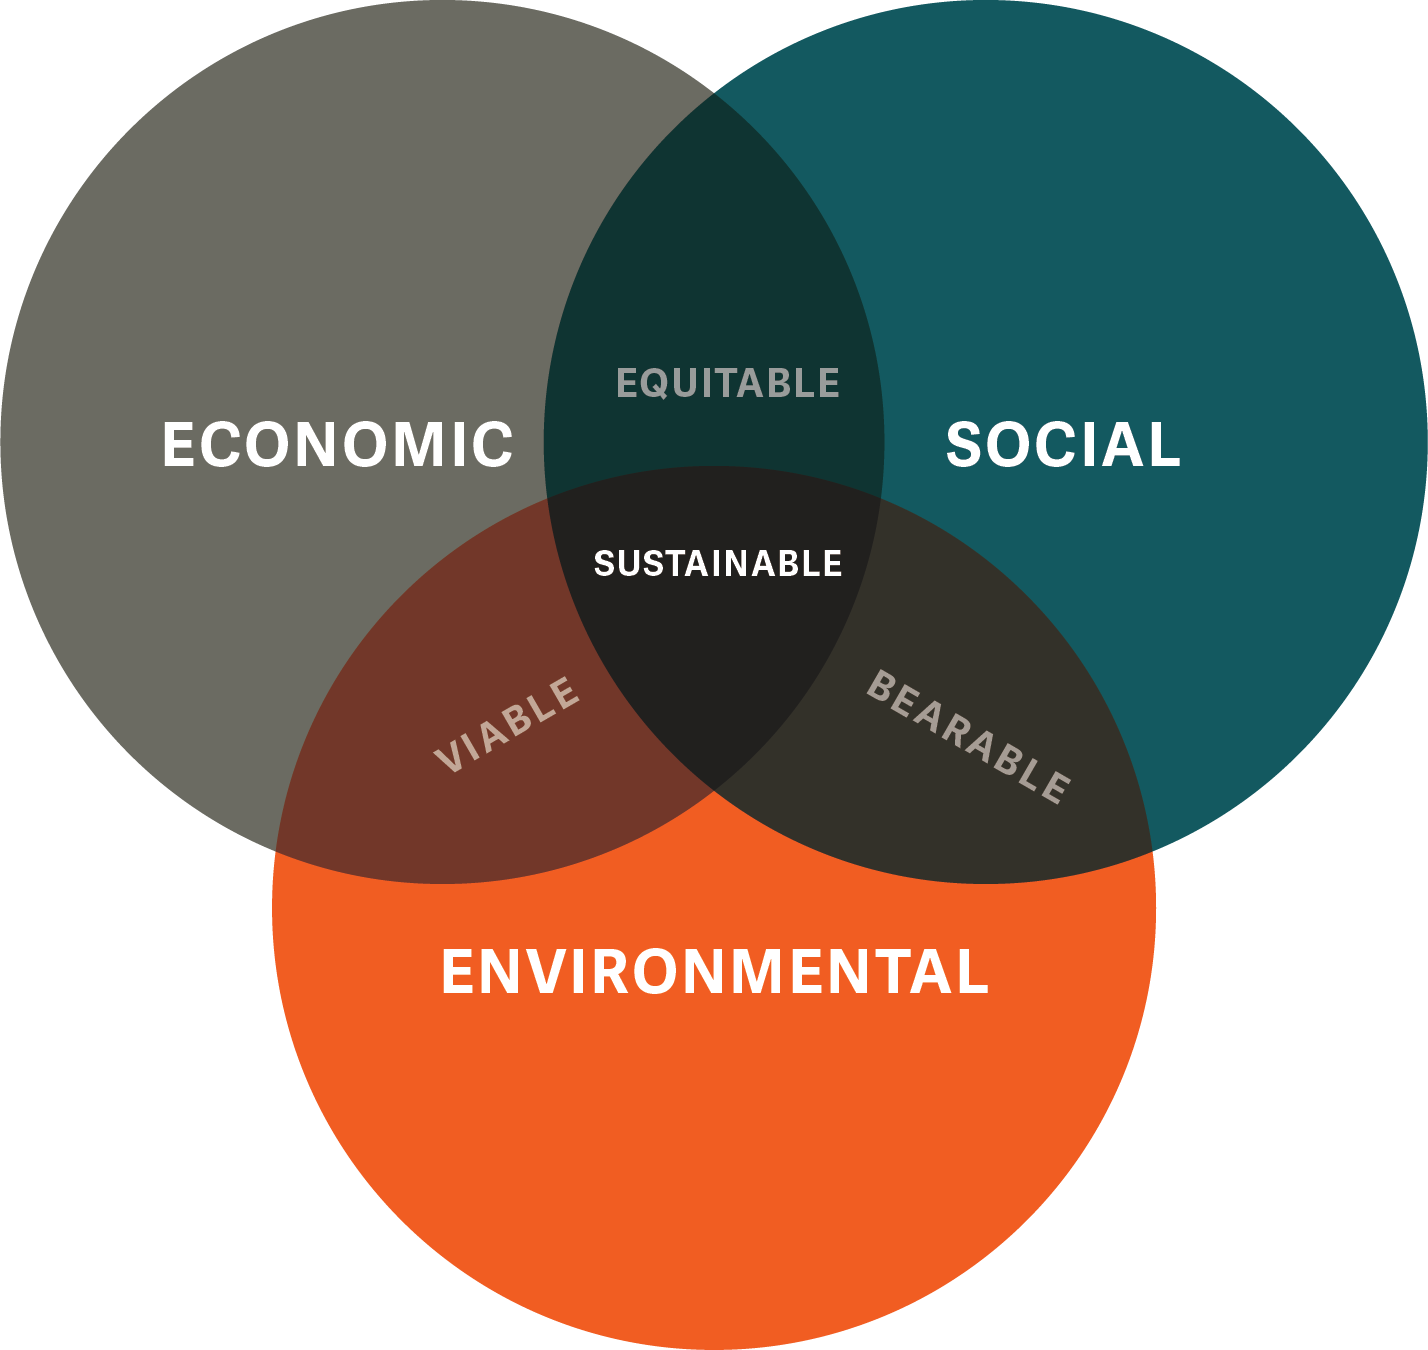
Next, I’ve included 5 different visualizations of sustainability. What do these add to our understanding of sustainability? What “argument” do they make? What makes them clear? What makes them confusing? Work in small groups to address these questions and be ready to report back!
The Pie
The Venn
The Wave
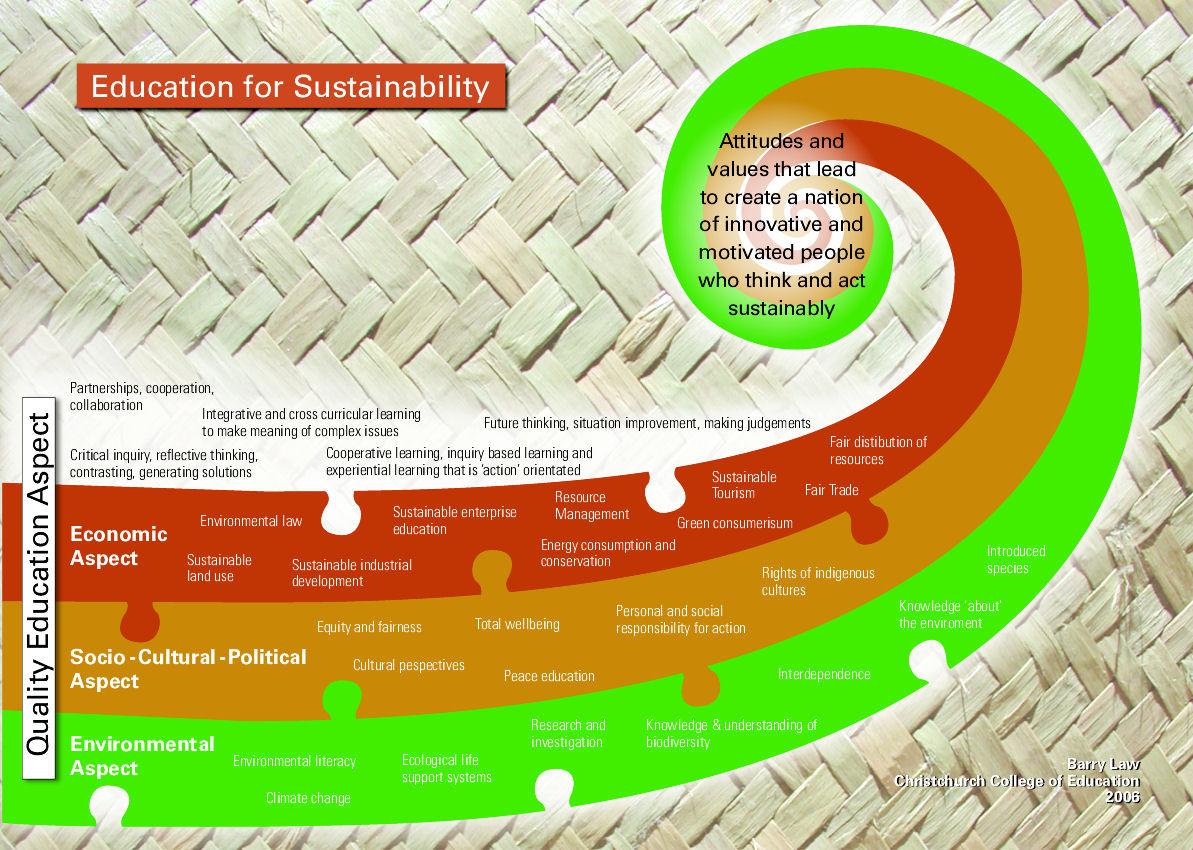
The Tree

The Metric