Bitesize research
Share this:

TLT Con Flyer come as you are 2020 half page
Share this:


Small Teaching Tip #22: Top Ten Teaching Tips
I’ve been writing the Small Teaching Tips series for three years and in that time, I have amassed a huge collection of blog posts, books, and articles dedicated to making small, progressive improvements to one’s teaching. There’s no need to make time-consuming, labor-intensive changes to your teaching in order to see incredible results. As author of the book Small Teaching: Everyday Lessons from the Science of Learning, and TLTCon 2020 keynote speaker, James Lang argues: “fundamental pedagogical improvement is possible through incremental change.” So I’d like to dedicate this post to my top ten favorite tips and hopefully inspire you to try a few in your own classes.
Let your students get to know you
Tell more stories/use more examples
Give students more control
Demystify office hours
Craft a learner-centered syllabus
Prioritize student collaboration
Design with brain science in mind
Always be learning / watch other teachers
Practice self-reflection
Take care of yourself
Share this:

Teaching and Course Observations
[et_pb_section bb_built=”1″][et_pb_row][et_pb_column type=”4_4″][et_pb_text _builder_version=”3.21.4″ z_index_tablet=”500″]
TLT is available to sit in on one or more of your classes and conduct observations that you can use to reflect on and possibly improve your teaching. We are also available to review your OAKS course for your online teaching.
[/et_pb_text][et_pb_text _builder_version=”3.21.4″ z_index_tablet=”500″]
 Here’s how it works…
[/et_pb_text][et_pb_testimonial _builder_version=”3.21.4″ quote_icon_background_color=”#f5f5f5″ z_index_tablet=”500″ text_orientation=”center” text_shadow_style=”preset1″ body_font_size=”20″ body_letter_spacing=”2px”]
Remember, this is just for you, no one else. We don’t mention it to your Chairs, Dean, or Colleagues.
[/et_pb_testimonial][et_pb_text _builder_version=”3.21.4″ z_index_tablet=”500″]
If you are interested, just complete the form below. Your instructional technologist will contact you to set up a meeting where we will discuss what you hope to get out of the observation. We’ll then conduct the observation of your choice and give you the deliverable that matches.
[/et_pb_text][et_pb_text _builder_version=”3.21.4″ z_index_tablet=”500″]
Types of Observations
[/et_pb_text][et_pb_text _builder_version=”3.21.4″ z_index_tablet=”500″]
TLThd offers two types of observations: Face-to-Face & Online
[/et_pb_text][/et_pb_column][/et_pb_row][et_pb_row][et_pb_column type=”1_2″][et_pb_text _builder_version=”3.21.4″ z_index_tablet=”500″]
Face-to-Face: Your instructional technologist will come to the class(es) of your choice and just track what is going on in the classroom, what you are doing and what your students are doing, in 2 minute increments. No judgement, just tracking/documenting. We’ll make no suggestions unless you request them. In addition, we’re happy to look for anything specific that you’d like us to.
With the Face-to-Face observations we also offer two add-ons that can be done in addition to the base observation:
- Video: We come to the class(es) of your choice and film you and/or your students during the class. When finished we provide you with a digital copy of the video and a self-reflection rubric that you can use if you so choose.
- Student Focus Groups: We go into your classroom and interview your students about what they think is working and not working in the class. The feedback is completely anonymous and you must leave the room. This is normally conducted in the last 10 minutes of a class. You can use our default questions and/or develop your own.
[/et_pb_text][/et_pb_column][et_pb_column type=”1_2″][et_pb_text _builder_version=”3.21.4″ z_index_tablet=”500″]
Online: Your instructional technologist will review a module in your OAKS class and look at anything from course organization to assignment directions. Whatever you’d like to know.
[/et_pb_text][/et_pb_column][/et_pb_row][et_pb_row][et_pb_column type=”4_4″][et_pb_text _builder_version=”3.21.4″ z_index_tablet=”500″]
The Process
[/et_pb_text][/et_pb_column][/et_pb_row][et_pb_row _builder_version=”3.21.4″ border_radii=”on|5px|5px|5px|5px” border_color_all=”#a00d00″ z_index_tablet=”500″ custom_padding=”10px|10px|10px|10px” border_width_all=”1px” box_shadow_style=”preset2″][et_pb_column type=”1_4″][et_pb_text _builder_version=”3.21.4″ z_index_tablet=”500″ border_radii=”on|5px|5px|5px|5px” border_color_all=”#7c0000″]
 Face-to-Face:
- You request an observation.
- You and your instructional technologist book an appointment to look closely at the observation instrument and to decide on areas of focus.
- Your instructional technologist observes your class(es) either at a time you prefer or unannounced, depending upon your preference. This observation consists of tracking what you do and what your students appear to be doing in two minute increments.
- Your instructional technologist writes up the report that contains a narrative of strengths, data gathered from the observation instrument, a play-by-play of what occurred in the course by time, and some potential areas of change.
- You read the report and reflect on the results.
- You and your instructional technologist then schedule another appointment to debrief on the report.
[/et_pb_text][/et_pb_column][et_pb_column type=”1_4″][et_pb_text _builder_version=”3.21.4″ z_index_tablet=”500″]
Video:
- You request a Face-to-Face observation add-on.
- You and your instructional technologist book an appointment to discuss where you wish to focus: on you, on your students, or both.
- Your instructional technologist records your class(es) either at a time you prefer or unannounced, depending upon your preference. This observation consists of setting up one or two cameras in the room to record the specified action.
- Your instructional technologist extracts the video and sends you a digital copy of either your teaching, the students in the room or both, along with a self-reflection rubric for you to use to evaluate your teaching.
- You watch the video and reflect on what you see/hear.
- You and your instructional technologist can then schedule another appointment to debrief on anything you wish to discuss.
[/et_pb_text][/et_pb_column][et_pb_column type=”1_4″][et_pb_text _builder_version=”3.21.4″ z_index_tablet=”500″]
Student Feedback:
- You request a Face-to-Face observation add-on.
- You and your instructional technologist book an appointment to decide where you wish to focus or if there are any specific concerns you have.
- Your instructional technologist sends a list of questions to your students two days before the observation so they can reflect on the questions.
- Your instructional technologist interviews your students in the last 15-20 minutes of a class at a time you prefer. This observation consists of your instructional technologist conducting a discussion of the student feedback. This is recorded in a completely anonymous way. This interview will consist of 3-4 questions that is a mix of standard questions and your questions.
- Your instructional technologist writes up the report that contains the summary of students’ answers to all questions.
- You read the report and reflect on the results.
- You and your instructional technologist can then schedule another appointment to debrief on the report.
[/et_pb_text][/et_pb_column][et_pb_column type=”1_4″][et_pb_text _builder_version=”3.21.4″ z_index_tablet=”500″]
Online:
- You request an observation.
- You and your instructional technologist book an appointment to decide where you wish to focus or if there are any specific concerns you have.
- Your instructional technologist will review the OAKS class module(s) as you requested. This can consist of going through every piece of content, reading instructions, checking dates, etc. Your instructional technologist will look for consistency and observe the class from a student perspective.
- Your instructional technologist writes up the report that contains a narrative of strengths and some potential areas of change.
- You read the report and reflect on the results.
- You and your instructional technologist can then schedule another appointment to debrief on the report.
[/et_pb_text][/et_pb_column][/et_pb_row][et_pb_row _builder_version=”3.21.4″ custom_margin=”5px|5px|5px|5px” z_index_tablet=”500″ module_alignment=”center”][et_pb_column type=”4_4″][et_pb_image _builder_version=”3.21.4″ src=”https://blogs.cofc.edu/tlt/files/2019/07/Screen-Shot-2019-07-19-at-2.23.51-PM.png” url=”https://docs.google.com/forms/d/e/1FAIpQLSc3g5zOY67B8W2LIZviQCWfnsJCsbnaOqhT-lIl3SIPv3dG7Q/viewform” url_new_window=”on” z_index_tablet=”500″ align=”center” /][/et_pb_column][/et_pb_row][/et_pb_section]
Share this:

Share this:

#OneNewThing: Insert Learning – insert instructional content into webpages
[et_pb_section bb_built=”1″][et_pb_row _builder_version=”3.18.8″][et_pb_column type=”4_4″][et_pb_text /][/et_pb_column][/et_pb_row][/et_pb_section]
Share this:

[et_pb_section bb_built=”1″][et_pb_row][/et_pb_row][et_pb_row][et_pb_column type=”1_4″][et_pb_signup _builder_version=”3.0.101″ /][/et_pb_column][et_pb_column type=”1_4″][/et_pb_column][et_pb_column type=”1_4″][/et_pb_column][et_pb_column type=”1_4″][/et_pb_column][/et_pb_row][/et_pb_section]
Share this:

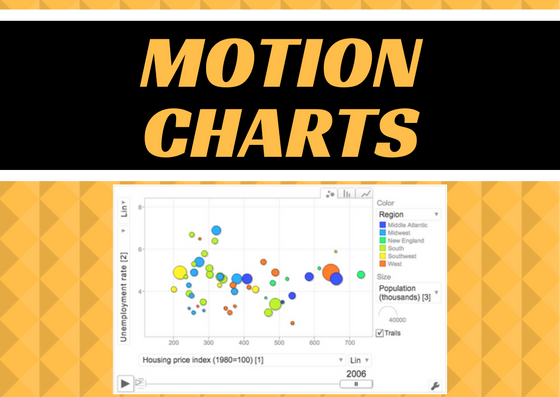
Using a Motion Chart to Visualize Data
While motion charts are not new, I just learned about them and I thought they would be something that faculty can use in their classes to help students see and understand certain concepts in their classes.
Motion Chart
A motion chart, at least as it’s used in this post, is a bubble chart that can be controlled by the viewer, not the creator. It allows the viewer to visualize multiple dimensions of the data. These dimensions are shown by the bubble size, color and position on the chart over time. Here is an example from Kwantu.com: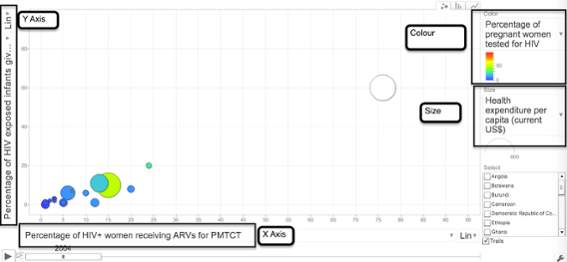
- Vertical (Y) axis – Percentage of HIV exposed infants given ART for PMTCT at birth
- Horizontal (X) axis – Percentage of HIV+ women receiving ARVs for PMTCT
- Bubble size – Health expenditure per capita (current US$)
- Bubble colour – Pregnant women receiving prenatal care (%)
- Time – Years
According to JuiceAnalytics, “modern-day motion charts were developed by an organization called GapMinder as part of a product called Trendalyzer. Hans Rosling, one of the founders of GapMinder, popularized the motion chart visualization in a much-admired TED Talk.”
What are they good for?
What I think sets this chart type apart from other charts in either Excel or Google Sheets, is that they are interactive. The end-user can use the sliders to change time and the dropdown menus to change the data parameters shown. It allows the viewer the control over what they see to help them better understand the data and to work with it in multiple ways. Any discipline that uses statistical or relational data over time can benefit from a motion chart (political science, sociology, history, education, biology, etc.).
How do you make one?
With Google Sheets, part of CofC’s Google Apps for Education (G-Suite), you can make a motion chart in just a few easy steps.
- Create the data in Google Sheets, or upload it from an existing Excel spreadsheet into Google Drive.
- Column A (first column) should contain the data you want to track. In the example above, it is Country.
- Column B should contain the time data and should be sorted/grouped by time.
- Column B also needs to be formatted as a date, not text.
- Highlight all the data in the table and click on Insert > Chart.
- Choose the Chart Types tab.
- Scroll to the bottom under Other and choose Motion Chart.
- Click Insert.
- Once it’s inserted you will be able to change the X/Y access, use the scroll bar to slide through the times and the boxes on the right to narrow the data seen.
BONUS — You’ll also notice, in the upper right corner, that you can choose between a bubble chart, bar chart, or a line chart.
Let us know
If you try this let us know how you are using it in your teaching or with your students! We love to hear from faculty.
Share this:

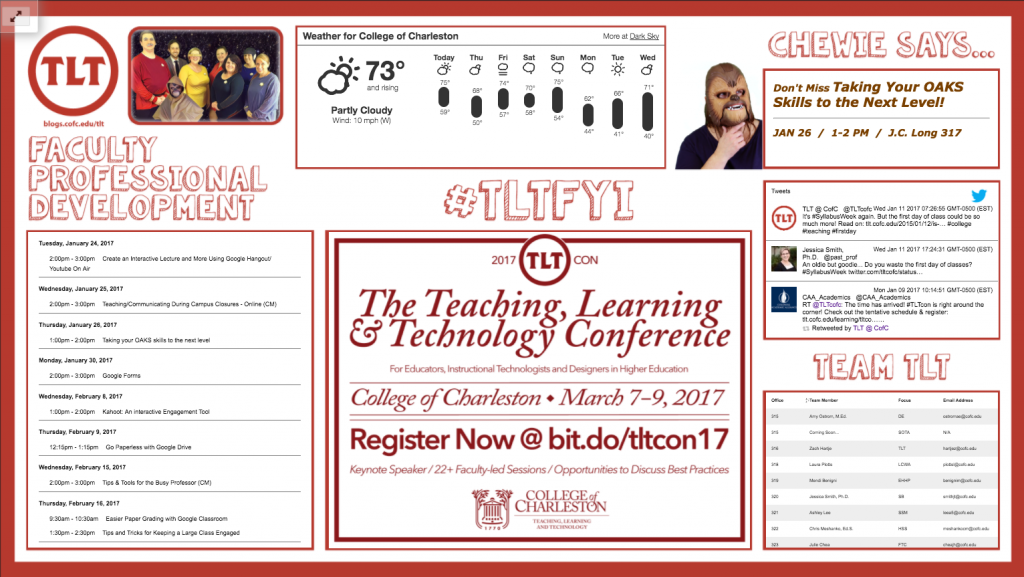
Design Time: Using Rise Vision Digital Signage Software to Create Multimedia Posters
When you think of digital signage, what’s the first thing that comes to mind? Is it the large digital billboards that dot the interstate? Perhaps it’s the arrival/departure signage in the airport? Well, in any case, digital signage is no longer as expensive and elusive as it once was in the not so distant past. Today, we can find digital signage everywhere–from restaurants and hotels, to banks and stores, and even the DMV. In fact, I designed the dynamic signage below, for our lobby, using only Adobe Illustrator and Rise Vision–and, of course, a Chromebox and display.
What is Rise Vision?
Rise Vision is a free, web-based application that allows users to turn any Windows, Linux, or Chrome-supported device (e.g., computer, Raspberry Pi, Chromebox, etc.), and monitor, into an interactive display. Gone are the days of static signage with limited information. What makes Rise Vision’s software so unique is that it
Creating Multimedia Posters