MOTION CHARTS
Google, Google Apps, instructional technology, Research

Using a Motion Chart to Visualize Data

While motion charts are not new, I just learned about them and I thought they would be something that faculty can use in their classes to help students see and understand certain concepts in their classes.

Motion Chart

A motion chart, at least as it’s used in this post, is a bubble chart that can be controlled by the viewer, not the creator.  It allows the viewer to visualize multiple dimensions of the data.   These dimensions are shown by the bubble size, color and position on the chart over time.  Here is an example from Kwantu.com:Screenshot of the bubble chart

  • Vertical (Y) axis – Percentage of HIV exposed infants given ART for PMTCT at birth
  • Horizontal (X) axis – Percentage of HIV+ women receiving ARVs for PMTCT
  • Bubble size – Health expenditure per capita (current US$)
  • Bubble colour – Pregnant women receiving prenatal care (%)
  • Time – Years

According to JuiceAnalytics, “modern-day motion charts were developed by an organization called GapMinder as part of a product called Trendalyzer.  Hans Rosling, one of the founders of GapMinder, popularized the motion chart visualization in a much-admired TED Talk.”

What are they good for?

What I think sets this chart type apart from other charts in either Excel or Google Sheets, is that they are interactive.  The end-user can use the sliders to change time and the dropdown menus to change the data parameters shown.  It allows the viewer the control over what they see to help them better understand the data and to work with it in multiple ways.  Any discipline that uses statistical or relational data over time can benefit from a motion chart (political science, sociology, history, education, biology, etc.).

How do you make one?

With Google Sheets, part of CofC’s Google Apps for Education (G-Suite), you can make a motion chart in just a few easy steps.

  1. Create the data in Google Sheets, or upload it from an existing Excel spreadsheet into Google Drive.
    1.  Column A (first column) should contain the data you want to track.  In the example above, it is Country.
    2.  Column B should contain the time data and should be sorted/grouped by time.
    3.  Column B also needs to be formatted as a date, not text.
  2. Highlight all the data in the table and click on Insert > Chart.
  3. Choose the Chart Types tab.
  4. Scroll to the bottom under Other and choose Motion Chart.
  5. Click Insert.
  6. Once it’s inserted you will be able to change the X/Y access, use the scroll bar to slide through the times and the boxes on the right to narrow the data seen.

BONUS — You’ll also notice, in the upper right corner, that you can choose between a bubble chart, bar chart, or a line chart.

Let us know

If you try this let us know how you are using it in your teaching or with your students!  We love to hear from faculty.

Assessment, Google Apps, Presentation, TLT

#OneNewThing: Creating Infographics Using Google Slides

Infographics are graphic visual representations of information, data, or knowledge intended to present information quickly and clearly. (wikipedia)  For the layman, they can make difficult to understand data or concepts more accessible by delivering only the most important data in an understandable way.  When students are asked to create infographics, it requires them to understand the data and concepts deeply enough to be able to distill them into digestible chunks that a layman can understand.  Because of this, I highly recommend incorporating an infographic assignment into your teaching.


While there are some free applications (Canva.com) that can be used to create infographics, my recommendation is to use Google Slides.  Google Slides is completely free, easy to use, familiar, and the students already have an account!  Here’s how you can do it:

Page Size:

Don’t worry about being restricted to the standard presentation size you see in Google Slides.  You can change the page to be any size you want!

Adding Images:

  • screenshot
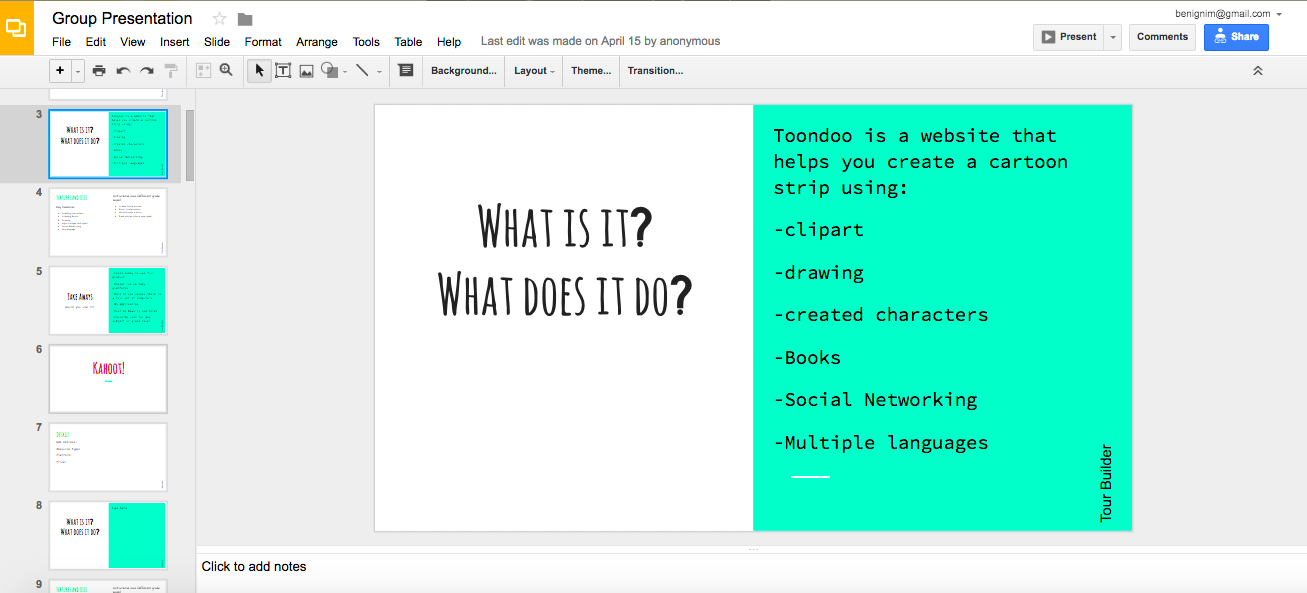
You can search the web for royalty free images directly from Slides or you can upload images from your computer (note: Pixabay.org gives you free images to use).
  • You can crop your images into shapes and add shadows and reflections.
  • You can also add a color overlay to some images to make them work for showing a percentage of people for instance.

Add Charts:

  • chart screenshotYou can add charts (pie, line, bar, and column charts) from directly within Slides.
  • You can also connect a chart from Google Sheets that will automatically update when you change the data in your spreadsheet!  Can’t do that in Canva.


Add Diagrams:

You can add anything from an org. chart to a timeline from within Slides as well.  They are professional looking and easy to update.

screenshot of diagrams

Add Shapes:

Shapes can be used to highlight or group text or data areas on an infographic.  Slides offers a wide range of shapes and call outs.

Add Text:

Slides offer a variety of font styles and sizes to meet your needs and the best part is that these will look the same on every computer regardless of the fonts installed on the viewer’s computer, which is critical on an infographic.

Shareable and Collaborative:

Because it’s a Google product it’s easy to share it for group or parter collaboration in creating and easy sharing to turn it in the instructor.

[button link=”https://docs.google.com/document/d/1uK22xphnEWkXn7nMDDn67NvU6cQMz9qcbkSeBVJDZOA/edit?usp=sharing” newwindow=”yes”] Access the tutorials for you and your students[/button]

Pedagogy Pointer: a quick guide to something new
Google Apps, Pedagogy, Presentation

Pecha Kucha to Promote Focused and Concise Presentations

[et_pb_section bb_built=”1″][et_pb_row][et_pb_column type=”4_4″][et_pb_text _builder_version=”4.8.2″ text_text_shadow_horizontal_length=”text_text_shadow_style,%91object Object%93″ text_text_shadow_horizontal_length_tablet=”0px” text_text_shadow_vertical_length=”text_text_shadow_style,%91object Object%93″ text_text_shadow_vertical_length_tablet=”0px” text_text_shadow_blur_strength=”text_text_shadow_style,%91object Object%93″ text_text_shadow_blur_strength_tablet=”1px” link_text_shadow_horizontal_length=”link_text_shadow_style,%91object Object%93″ link_text_shadow_horizontal_length_tablet=”0px” link_text_shadow_vertical_length=”link_text_shadow_style,%91object Object%93″ link_text_shadow_vertical_length_tablet=”0px” link_text_shadow_blur_strength=”link_text_shadow_style,%91object Object%93″ link_text_shadow_blur_strength_tablet=”1px” ul_text_shadow_horizontal_length=”ul_text_shadow_style,%91object Object%93″ ul_text_shadow_horizontal_length_tablet=”0px” ul_text_shadow_vertical_length=”ul_text_shadow_style,%91object Object%93″ ul_text_shadow_vertical_length_tablet=”0px” ul_text_shadow_blur_strength=”ul_text_shadow_style,%91object Object%93″ ul_text_shadow_blur_strength_tablet=”1px” ol_text_shadow_horizontal_length=”ol_text_shadow_style,%91object Object%93″ ol_text_shadow_horizontal_length_tablet=”0px” ol_text_shadow_vertical_length=”ol_text_shadow_style,%91object Object%93″ ol_text_shadow_vertical_length_tablet=”0px” ol_text_shadow_blur_strength=”ol_text_shadow_style,%91object Object%93″ ol_text_shadow_blur_strength_tablet=”1px” quote_text_shadow_horizontal_length=”quote_text_shadow_style,%91object Object%93″ quote_text_shadow_horizontal_length_tablet=”0px” quote_text_shadow_vertical_length=”quote_text_shadow_style,%91object Object%93″ quote_text_shadow_vertical_length_tablet=”0px” quote_text_shadow_blur_strength=”quote_text_shadow_style,%91object Object%93″ quote_text_shadow_blur_strength_tablet=”1px” header_text_shadow_horizontal_length=”header_text_shadow_style,%91object Object%93″ header_text_shadow_horizontal_length_tablet=”0px” header_text_shadow_vertical_length=”header_text_shadow_style,%91object Object%93″ header_text_shadow_vertical_length_tablet=”0px” header_text_shadow_blur_strength=”header_text_shadow_style,%91object Object%93″ header_text_shadow_blur_strength_tablet=”1px” header_2_text_shadow_horizontal_length=”header_2_text_shadow_style,%91object Object%93″ header_2_text_shadow_horizontal_length_tablet=”0px” header_2_text_shadow_vertical_length=”header_2_text_shadow_style,%91object Object%93″ header_2_text_shadow_vertical_length_tablet=”0px” header_2_text_shadow_blur_strength=”header_2_text_shadow_style,%91object Object%93″ header_2_text_shadow_blur_strength_tablet=”1px” header_3_text_shadow_horizontal_length=”header_3_text_shadow_style,%91object Object%93″ header_3_text_shadow_horizontal_length_tablet=”0px” header_3_text_shadow_vertical_length=”header_3_text_shadow_style,%91object Object%93″ header_3_text_shadow_vertical_length_tablet=”0px” header_3_text_shadow_blur_strength=”header_3_text_shadow_style,%91object Object%93″ header_3_text_shadow_blur_strength_tablet=”1px” header_4_text_shadow_horizontal_length=”header_4_text_shadow_style,%91object Object%93″ header_4_text_shadow_horizontal_length_tablet=”0px” header_4_text_shadow_vertical_length=”header_4_text_shadow_style,%91object Object%93″ header_4_text_shadow_vertical_length_tablet=”0px” header_4_text_shadow_blur_strength=”header_4_text_shadow_style,%91object Object%93″ header_4_text_shadow_blur_strength_tablet=”1px” header_5_text_shadow_horizontal_length=”header_5_text_shadow_style,%91object Object%93″ header_5_text_shadow_horizontal_length_tablet=”0px” header_5_text_shadow_vertical_length=”header_5_text_shadow_style,%91object Object%93″ header_5_text_shadow_vertical_length_tablet=”0px” header_5_text_shadow_blur_strength=”header_5_text_shadow_style,%91object Object%93″ header_5_text_shadow_blur_strength_tablet=”1px” header_6_text_shadow_horizontal_length=”header_6_text_shadow_style,%91object Object%93″ header_6_text_shadow_horizontal_length_tablet=”0px” header_6_text_shadow_vertical_length=”header_6_text_shadow_style,%91object Object%93″ header_6_text_shadow_vertical_length_tablet=”0px” header_6_text_shadow_blur_strength=”header_6_text_shadow_style,%91object Object%93″ header_6_text_shadow_blur_strength_tablet=”1px” box_shadow_horizontal_tablet=”0px” box_shadow_vertical_tablet=”0px” box_shadow_blur_tablet=”40px” box_shadow_spread_tablet=”0px” vertical_offset_tablet=”0″ horizontal_offset_tablet=”0″ z_index_tablet=”0″]

Pecha Kucha is a presentation style that consists of only 20 slides with only 20 seconds to discuss each slide.  This results in a total presentation of exactly 6 minutes and 40 seconds.  The slides are set to automatically advance requiring the speaker to prepare and practice, as there is no option to go back or skip ahead.  This style also requires the presenter to concise and brief and pull out the most cogent points to present.

Pecha Kucha is also a very visual presentation style. It is based on single powerful images and very little, if any, text on the slides. The presenter must know the topic well in order to select the most powerful images to represent each point which is another benefit of this style.

[/et_pb_text][et_pb_text _builder_version=”4.8.2″ text_text_shadow_horizontal_length=”text_text_shadow_style,%91object Object%93″ text_text_shadow_horizontal_length_tablet=”0px” text_text_shadow_vertical_length=”text_text_shadow_style,%91object Object%93″ text_text_shadow_vertical_length_tablet=”0px” text_text_shadow_blur_strength=”text_text_shadow_style,%91object Object%93″ text_text_shadow_blur_strength_tablet=”1px” link_text_shadow_horizontal_length=”link_text_shadow_style,%91object Object%93″ link_text_shadow_horizontal_length_tablet=”0px” link_text_shadow_vertical_length=”link_text_shadow_style,%91object Object%93″ link_text_shadow_vertical_length_tablet=”0px” link_text_shadow_blur_strength=”link_text_shadow_style,%91object Object%93″ link_text_shadow_blur_strength_tablet=”1px” ul_text_shadow_horizontal_length=”ul_text_shadow_style,%91object Object%93″ ul_text_shadow_horizontal_length_tablet=”0px” ul_text_shadow_vertical_length=”ul_text_shadow_style,%91object Object%93″ ul_text_shadow_vertical_length_tablet=”0px” ul_text_shadow_blur_strength=”ul_text_shadow_style,%91object Object%93″ ul_text_shadow_blur_strength_tablet=”1px” ol_text_shadow_horizontal_length=”ol_text_shadow_style,%91object Object%93″ ol_text_shadow_horizontal_length_tablet=”0px” ol_text_shadow_vertical_length=”ol_text_shadow_style,%91object Object%93″ ol_text_shadow_vertical_length_tablet=”0px” ol_text_shadow_blur_strength=”ol_text_shadow_style,%91object Object%93″ ol_text_shadow_blur_strength_tablet=”1px” quote_text_shadow_horizontal_length=”quote_text_shadow_style,%91object Object%93″ quote_text_shadow_horizontal_length_tablet=”0px” quote_text_shadow_vertical_length=”quote_text_shadow_style,%91object Object%93″ quote_text_shadow_vertical_length_tablet=”0px” quote_text_shadow_blur_strength=”quote_text_shadow_style,%91object Object%93″ quote_text_shadow_blur_strength_tablet=”1px” header_text_shadow_horizontal_length=”header_text_shadow_style,%91object Object%93″ header_text_shadow_horizontal_length_tablet=”0px” header_text_shadow_vertical_length=”header_text_shadow_style,%91object Object%93″ header_text_shadow_vertical_length_tablet=”0px” header_text_shadow_blur_strength=”header_text_shadow_style,%91object Object%93″ header_text_shadow_blur_strength_tablet=”1px” header_2_text_shadow_horizontal_length=”header_2_text_shadow_style,%91object Object%93″ header_2_text_shadow_horizontal_length_tablet=”0px” header_2_text_shadow_vertical_length=”header_2_text_shadow_style,%91object Object%93″ header_2_text_shadow_vertical_length_tablet=”0px” header_2_text_shadow_blur_strength=”header_2_text_shadow_style,%91object Object%93″ header_2_text_shadow_blur_strength_tablet=”1px” header_3_text_shadow_horizontal_length=”header_3_text_shadow_style,%91object Object%93″ header_3_text_shadow_horizontal_length_tablet=”0px” header_3_text_shadow_vertical_length=”header_3_text_shadow_style,%91object Object%93″ header_3_text_shadow_vertical_length_tablet=”0px” header_3_text_shadow_blur_strength=”header_3_text_shadow_style,%91object Object%93″ header_3_text_shadow_blur_strength_tablet=”1px” header_4_text_shadow_horizontal_length=”header_4_text_shadow_style,%91object Object%93″ header_4_text_shadow_horizontal_length_tablet=”0px” header_4_text_shadow_vertical_length=”header_4_text_shadow_style,%91object Object%93″ header_4_text_shadow_vertical_length_tablet=”0px” header_4_text_shadow_blur_strength=”header_4_text_shadow_style,%91object Object%93″ header_4_text_shadow_blur_strength_tablet=”1px” header_5_text_shadow_horizontal_length=”header_5_text_shadow_style,%91object Object%93″ header_5_text_shadow_horizontal_length_tablet=”0px” header_5_text_shadow_vertical_length=”header_5_text_shadow_style,%91object Object%93″ header_5_text_shadow_vertical_length_tablet=”0px” header_5_text_shadow_blur_strength=”header_5_text_shadow_style,%91object Object%93″ header_5_text_shadow_blur_strength_tablet=”1px” header_6_text_shadow_horizontal_length=”header_6_text_shadow_style,%91object Object%93″ header_6_text_shadow_horizontal_length_tablet=”0px” header_6_text_shadow_vertical_length=”header_6_text_shadow_style,%91object Object%93″ header_6_text_shadow_vertical_length_tablet=”0px” header_6_text_shadow_blur_strength=”header_6_text_shadow_style,%91object Object%93″ header_6_text_shadow_blur_strength_tablet=”1px” box_shadow_horizontal_tablet=”0px” box_shadow_vertical_tablet=”0px” box_shadow_blur_tablet=”40px” box_shadow_spread_tablet=”0px” vertical_offset_tablet=”0″ horizontal_offset_tablet=”0″ z_index_tablet=”0″]

BENEFITS OF USING PECHA KUCHA PRESENTATIONS IN CLASS

[/et_pb_text][et_pb_text _builder_version=”4.8.2″ text_text_shadow_horizontal_length=”text_text_shadow_style,%91object Object%93″ text_text_shadow_horizontal_length_tablet=”0px” text_text_shadow_vertical_length=”text_text_shadow_style,%91object Object%93″ text_text_shadow_vertical_length_tablet=”0px” text_text_shadow_blur_strength=”text_text_shadow_style,%91object Object%93″ text_text_shadow_blur_strength_tablet=”1px” link_text_shadow_horizontal_length=”link_text_shadow_style,%91object Object%93″ link_text_shadow_horizontal_length_tablet=”0px” link_text_shadow_vertical_length=”link_text_shadow_style,%91object Object%93″ link_text_shadow_vertical_length_tablet=”0px” link_text_shadow_blur_strength=”link_text_shadow_style,%91object Object%93″ link_text_shadow_blur_strength_tablet=”1px” ul_text_shadow_horizontal_length=”ul_text_shadow_style,%91object Object%93″ ul_text_shadow_horizontal_length_tablet=”0px” ul_text_shadow_vertical_length=”ul_text_shadow_style,%91object Object%93″ ul_text_shadow_vertical_length_tablet=”0px” ul_text_shadow_blur_strength=”ul_text_shadow_style,%91object Object%93″ ul_text_shadow_blur_strength_tablet=”1px” ol_text_shadow_horizontal_length=”ol_text_shadow_style,%91object Object%93″ ol_text_shadow_horizontal_length_tablet=”0px” ol_text_shadow_vertical_length=”ol_text_shadow_style,%91object Object%93″ ol_text_shadow_vertical_length_tablet=”0px” ol_text_shadow_blur_strength=”ol_text_shadow_style,%91object Object%93″ ol_text_shadow_blur_strength_tablet=”1px” quote_text_shadow_horizontal_length=”quote_text_shadow_style,%91object Object%93″ quote_text_shadow_horizontal_length_tablet=”0px” quote_text_shadow_vertical_length=”quote_text_shadow_style,%91object Object%93″ quote_text_shadow_vertical_length_tablet=”0px” quote_text_shadow_blur_strength=”quote_text_shadow_style,%91object Object%93″ quote_text_shadow_blur_strength_tablet=”1px” header_text_shadow_horizontal_length=”header_text_shadow_style,%91object Object%93″ header_text_shadow_horizontal_length_tablet=”0px” header_text_shadow_vertical_length=”header_text_shadow_style,%91object Object%93″ header_text_shadow_vertical_length_tablet=”0px” header_text_shadow_blur_strength=”header_text_shadow_style,%91object Object%93″ header_text_shadow_blur_strength_tablet=”1px” header_2_text_shadow_horizontal_length=”header_2_text_shadow_style,%91object Object%93″ header_2_text_shadow_horizontal_length_tablet=”0px” header_2_text_shadow_vertical_length=”header_2_text_shadow_style,%91object Object%93″ header_2_text_shadow_vertical_length_tablet=”0px” header_2_text_shadow_blur_strength=”header_2_text_shadow_style,%91object Object%93″ header_2_text_shadow_blur_strength_tablet=”1px” header_3_text_shadow_horizontal_length=”header_3_text_shadow_style,%91object Object%93″ header_3_text_shadow_horizontal_length_tablet=”0px” header_3_text_shadow_vertical_length=”header_3_text_shadow_style,%91object Object%93″ header_3_text_shadow_vertical_length_tablet=”0px” header_3_text_shadow_blur_strength=”header_3_text_shadow_style,%91object Object%93″ header_3_text_shadow_blur_strength_tablet=”1px” header_4_text_shadow_horizontal_length=”header_4_text_shadow_style,%91object Object%93″ header_4_text_shadow_horizontal_length_tablet=”0px” header_4_text_shadow_vertical_length=”header_4_text_shadow_style,%91object Object%93″ header_4_text_shadow_vertical_length_tablet=”0px” header_4_text_shadow_blur_strength=”header_4_text_shadow_style,%91object Object%93″ header_4_text_shadow_blur_strength_tablet=”1px” header_5_text_shadow_horizontal_length=”header_5_text_shadow_style,%91object Object%93″ header_5_text_shadow_horizontal_length_tablet=”0px” header_5_text_shadow_vertical_length=”header_5_text_shadow_style,%91object Object%93″ header_5_text_shadow_vertical_length_tablet=”0px” header_5_text_shadow_blur_strength=”header_5_text_shadow_style,%91object Object%93″ header_5_text_shadow_blur_strength_tablet=”1px” header_6_text_shadow_horizontal_length=”header_6_text_shadow_style,%91object Object%93″ header_6_text_shadow_horizontal_length_tablet=”0px” header_6_text_shadow_vertical_length=”header_6_text_shadow_style,%91object Object%93″ header_6_text_shadow_vertical_length_tablet=”0px” header_6_text_shadow_blur_strength=”header_6_text_shadow_style,%91object Object%93″ header_6_text_shadow_blur_strength_tablet=”1px” box_shadow_horizontal_tablet=”0px” box_shadow_vertical_tablet=”0px” box_shadow_blur_tablet=”40px” box_shadow_spread_tablet=”0px” vertical_offset_tablet=”0″ horizontal_offset_tablet=”0″ z_index_tablet=”0″]

  1. Presentations are under 7 minutes which allows you to do more in less time.
  2. Students must learn how to pick out the most important points from their topic and deliver it in a way that others can understand.
  3. Students must learn to illustrate their topic and points using high-impact images and very little text.

[/et_pb_text][et_pb_video _builder_version=”4.8.2″ box_shadow_horizontal_tablet=”0px” box_shadow_vertical_tablet=”0px” box_shadow_blur_tablet=”40px” box_shadow_spread_tablet=”0px” vertical_offset_tablet=”0″ horizontal_offset_tablet=”0″ z_index_tablet=”0″ /][et_pb_text _builder_version=”4.8.2″ text_text_shadow_horizontal_length=”text_text_shadow_style,%91object Object%93″ text_text_shadow_horizontal_length_tablet=”0px” text_text_shadow_vertical_length=”text_text_shadow_style,%91object Object%93″ text_text_shadow_vertical_length_tablet=”0px” text_text_shadow_blur_strength=”text_text_shadow_style,%91object Object%93″ text_text_shadow_blur_strength_tablet=”1px” link_text_shadow_horizontal_length=”link_text_shadow_style,%91object Object%93″ link_text_shadow_horizontal_length_tablet=”0px” link_text_shadow_vertical_length=”link_text_shadow_style,%91object Object%93″ link_text_shadow_vertical_length_tablet=”0px” link_text_shadow_blur_strength=”link_text_shadow_style,%91object Object%93″ link_text_shadow_blur_strength_tablet=”1px” ul_text_shadow_horizontal_length=”ul_text_shadow_style,%91object Object%93″ ul_text_shadow_horizontal_length_tablet=”0px” ul_text_shadow_vertical_length=”ul_text_shadow_style,%91object Object%93″ ul_text_shadow_vertical_length_tablet=”0px” ul_text_shadow_blur_strength=”ul_text_shadow_style,%91object Object%93″ ul_text_shadow_blur_strength_tablet=”1px” ol_text_shadow_horizontal_length=”ol_text_shadow_style,%91object Object%93″ ol_text_shadow_horizontal_length_tablet=”0px” ol_text_shadow_vertical_length=”ol_text_shadow_style,%91object Object%93″ ol_text_shadow_vertical_length_tablet=”0px” ol_text_shadow_blur_strength=”ol_text_shadow_style,%91object Object%93″ ol_text_shadow_blur_strength_tablet=”1px” quote_text_shadow_horizontal_length=”quote_text_shadow_style,%91object Object%93″ quote_text_shadow_horizontal_length_tablet=”0px” quote_text_shadow_vertical_length=”quote_text_shadow_style,%91object Object%93″ quote_text_shadow_vertical_length_tablet=”0px” quote_text_shadow_blur_strength=”quote_text_shadow_style,%91object Object%93″ quote_text_shadow_blur_strength_tablet=”1px” header_text_shadow_horizontal_length=”header_text_shadow_style,%91object Object%93″ header_text_shadow_horizontal_length_tablet=”0px” header_text_shadow_vertical_length=”header_text_shadow_style,%91object Object%93″ header_text_shadow_vertical_length_tablet=”0px” header_text_shadow_blur_strength=”header_text_shadow_style,%91object Object%93″ header_text_shadow_blur_strength_tablet=”1px” header_2_text_shadow_horizontal_length=”header_2_text_shadow_style,%91object Object%93″ header_2_text_shadow_horizontal_length_tablet=”0px” header_2_text_shadow_vertical_length=”header_2_text_shadow_style,%91object Object%93″ header_2_text_shadow_vertical_length_tablet=”0px” header_2_text_shadow_blur_strength=”header_2_text_shadow_style,%91object Object%93″ header_2_text_shadow_blur_strength_tablet=”1px” header_3_text_shadow_horizontal_length=”header_3_text_shadow_style,%91object Object%93″ header_3_text_shadow_horizontal_length_tablet=”0px” header_3_text_shadow_vertical_length=”header_3_text_shadow_style,%91object Object%93″ header_3_text_shadow_vertical_length_tablet=”0px” header_3_text_shadow_blur_strength=”header_3_text_shadow_style,%91object Object%93″ header_3_text_shadow_blur_strength_tablet=”1px” header_4_text_shadow_horizontal_length=”header_4_text_shadow_style,%91object Object%93″ header_4_text_shadow_horizontal_length_tablet=”0px” header_4_text_shadow_vertical_length=”header_4_text_shadow_style,%91object Object%93″ header_4_text_shadow_vertical_length_tablet=”0px” header_4_text_shadow_blur_strength=”header_4_text_shadow_style,%91object Object%93″ header_4_text_shadow_blur_strength_tablet=”1px” header_5_text_shadow_horizontal_length=”header_5_text_shadow_style,%91object Object%93″ header_5_text_shadow_horizontal_length_tablet=”0px” header_5_text_shadow_vertical_length=”header_5_text_shadow_style,%91object Object%93″ header_5_text_shadow_vertical_length_tablet=”0px” header_5_text_shadow_blur_strength=”header_5_text_shadow_style,%91object Object%93″ header_5_text_shadow_blur_strength_tablet=”1px” header_6_text_shadow_horizontal_length=”header_6_text_shadow_style,%91object Object%93″ header_6_text_shadow_horizontal_length_tablet=”0px” header_6_text_shadow_vertical_length=”header_6_text_shadow_style,%91object Object%93″ header_6_text_shadow_vertical_length_tablet=”0px” header_6_text_shadow_blur_strength=”header_6_text_shadow_style,%91object Object%93″ header_6_text_shadow_blur_strength_tablet=”1px” box_shadow_horizontal_tablet=”0px” box_shadow_vertical_tablet=”0px” box_shadow_blur_tablet=”40px” box_shadow_spread_tablet=”0px” vertical_offset_tablet=”0″ horizontal_offset_tablet=”0″ z_index_tablet=”0″]

LEARN HOW TO CREATE PECHA KUCHA IN DIFFERENT APPLICATIONS

[/et_pb_text][/et_pb_column][/et_pb_row][et_pb_row][et_pb_column type=”1_3″][et_pb_image _builder_version=”4.8.2″ src=”https://blogs.cofc.edu/tlt/files/2021/02/1.png” url=”https://www.youtube.com/watch?v=l9zxNTpNMLo&feature=youtu.be” url_new_window=”on” box_shadow_horizontal_tablet=”0px” box_shadow_vertical_tablet=”0px” box_shadow_blur_tablet=”40px” box_shadow_spread_tablet=”0px” vertical_offset_tablet=”0″ horizontal_offset_tablet=”0″ z_index_tablet=”0″ /][/et_pb_column][et_pb_column type=”1_3″][et_pb_image _builder_version=”4.8.2″ src=”https://blogs.cofc.edu/tlt/files/2021/02/2.png” url=”https://www.youtube.com/watch?v=ia6n129RmxU&feature=youtu.be” url_new_window=”on” box_shadow_horizontal_tablet=”0px” box_shadow_vertical_tablet=”0px” box_shadow_blur_tablet=”40px” box_shadow_spread_tablet=”0px” vertical_offset_tablet=”0″ horizontal_offset_tablet=”0″ z_index_tablet=”0″ /][/et_pb_column][et_pb_column type=”1_3″][et_pb_image _builder_version=”4.8.2″ src=”https://blogs.cofc.edu/tlt/files/2021/02/3.png” url=”https://www.youtube.com/watch?v=4I65a-sYHdQ&feature=youtu.be” url_new_window=”on” box_shadow_horizontal_tablet=”0px” box_shadow_vertical_tablet=”0px” box_shadow_blur_tablet=”40px” box_shadow_spread_tablet=”0px” vertical_offset_tablet=”0″ horizontal_offset_tablet=”0″ z_index_tablet=”0″ /][/et_pb_column][/et_pb_row][/et_pb_section]

Top Secret
Best Practices, Google, Google Apps, TLT

#OneNewThing: Secret Google Drive Sharing Tips!

Google Drive makes it easy to share any file with someone as either VIEW ONLY or EDIT via the SHARE button in any Docs, Sheets or Slides file. But did you know that there are other methods to share?

Preview Mode:

Preview mode is a cleaner look for sharing on websites or with others.

Use this when you want to viewer to only view the document but not make a copy of it into their own Google Drive.  When you share a Google file as View Only it still gives the users an opportunity to download it or to copy it into their own Google Drive.

Regular Sharing Mode:
Regular share showing the Google Docs menu bar at the top

Preview Mode:

When you use PREVIEW mode it’s cleaner and has no copy/download options
Preview mode with no menu bar showing

How to Use Preview Mode

  1. Start in Google Drive inside your file.
  2. Click the Share button in the upper corner.
  3. Click on Get Shareable Link and choose Anyone with the link can view.
  4. Copy the link given.
  5. Open a Word document, Google Doc, or a Text Note and paste the url you copied into that document.
  6. Highlight the end of the url, everything from the word Edit or View on and delete it.
  7. Now, in it’s place, type in the word preview.
  8. Copy this new URL and use it wherever you want (webpage, blog, etc.)

Example: https://docs.google.com/document/d/1Qutrs_d25LuUioopq2VFUV6iJe2GNYxSxrUJeZeXovM/preview

Copy Mode

Copy mode forces the file to be copied into the viewer’s Google Drive account before they can view it.

You can use this when you want to give a handout, worksheet, or template to your students for them to complete without altering the original.  When you share a Google file as View Only it can be copied into a user’s Google Drive but the user has to know how to do this.  Using the copy mode the user is prompted to copy the file and doesn’t have to know how to manually do it.

copy document screen with blue "make a copy" button
Above is what the user will see when they click on a link modifies for Copy mode.  Clicking on Make a Copy will automatically copy the file into their Google Drive.

How to Use Copy Mode

  1. Start in Google Drive inside your file.
  2. Click the Share button in the upper corner.
  3. Click on Get Shareable Link and choose Anyone with the link can view.
  4. Copy the link given.
  5. Open a Word document, Google Doc, or a Text Note and paste the url you copied into that document.
  6. Highlight the end of the url, everything from the word Edit or View on and delete it.
  7. Now, in it’s place, type in the word copy.
  8. Copy this new URL and use it wherever you want (webpage, blog, etc.)

Example: https://docs.google.com/document/d/1Qutrs_d25LuUioopq2VFUV6iJe2GNYxSxrUJeZeXovM/copy

Other Options

Other options available using the method outlined above.  Just replace the Edit/View area of the URL with:

export?format=doc – forces the Doc to download as a Word file.
export?format=pdf – forces the Doc to download as a PDF file.
export?format=rtf – forces the Doc to download as a Rich Text Fomat file.
export?format=txt – forces the Doc to download as a Plain Text file.
export?format=html – forces the Doc to download as an HTML (web) file.

Example: https://docs.google.com/document/d/1Qutrs_d25LuUioopq2VFUV6iJe2GNYxSxrUJeZeXovM/export?format=doc


Copy Mode:

6 reasons to use google docs
Best Practices, Google, Google Apps, Productivity

6 Reasons To Use Google Docs Instead Of Word

The latest installment in my series on 6 Reasons To Use Google Apps For Education will take a look at Google Docs.  Google Docs is a free, web-based, word processing application that is basically like Microsoft Word.  All files are automatically saved to the cloud so you never lose anything and can access your work from any computer, anywhere, using just a web-browser. In my mind, this alone is reason enough to use it.  As a matter of fact, a month ago my computer died…completely.  However, all of my files were saved to Google Drive so I didn’t lose ANYTHING!   The other benefit to using Docs is that your students already have CofC Google accounts and it’s easy for them to use and access if you want to use it in your classes.  Just like Microsoft Word, Google Docs allows you to write and edit documents, autosave, add images and tables, and create footnotes and bibliographies.  But there are so many more features that set this tool apart from Word (way more than six)!  Google Docs has all of the same collaboration, sharing and revision history that the other Google tools have (see the other posts in this series on Google Sheets and Google Slides to learn more) so I’m not going to include those below.

So without further ado, here are six reasons you should be using Google Docs instead of Word:

Reason 1: Speech To Text

Speech to text iconSpeech to Text allows you to speak into your computer’s microphone and Google Docs will type what you say.  It isn’t perfect but it’s pretty darn good.  I am impressed with its accuracy without any of the voice training normally required by these types of applications.  I recently read an article that discusses how well it does with dialects and accents.  It also apparently works with a plethora of languages.  NOTE: It only works with Google Chrome web browser but that shouldn’t be a deal breaker.  To learn more visit Type with your voice on the Google Docs help pages.

Reason 2: Add-Ons

I love the concept of add-ons for a program because it allows users to add features that aren’t built into the program.  My two favorite add-ons right now are SAS Writer Reviser and EasyBib, but there are others that sound really helpful such as VexTab Music Notation, Math, Rhyme Finder, and Teacher Rubric (disclaimer: I haven’t tried the last four).

Reason 3: Document Outline

If you use the built-in style headers then Google Docs will automatically build a document outline that allows you to jump to any point in a document.  Unlike a table of contents in Word, this outline always stays on the side of the screen, allowing you to easily navigate the document.  Also, unlike the table of contents, the outline is updated automatically each time you add a new header.  No more need to refresh the table.  Access it under Tools > Document Outline.  To learn more visit Edit and use a document outline in the Google help files.

screenshot of the Explore panelReason 4: Explore

The Explore feature is available in each of the main Google tools but it does something different in each tool.  In Google Docs, clicking on the Explore icon in the lower right corner of the window will bring up suggestions related to your entire document or to just the text you have highlighted.  In Docs, Explore will show you topics included in the selected area, creative commons images that are related to the text, and related research articles pulled from the public web and Google Scholar.

Reason 5: Built-in Drawing Tool

Google Drawing is built-in to Google Doc, allowing you to create charts, diagrams, and drawings without leaving your document.

Reason 6: Publish To Web

In addition to fantastic sharing and collaborating features, Google Docs allows users to save their document as a webpage.  While you may be saying, “Well Word lets you save as a webpage,” you would be correct, however what Word doesn’t do is publish it to the web and give it a URL.  This makes it very easy for students to share their work to an outside eportfolio or a blog or just publish it on the web for others to read.  Giving our students a public audience for their work is an important component of some majors and this is an easy way to accomplish it.

I hope that I have been able to sway you, if not to completely change to Google Docs, at least to give it a try.  It has evolved over the years into a stellar product so if you haven’t tried it in awhile (a year) then give it another chance.  I think it will win you over!


Easier Paper Grading with Google Classroom
Assessment, Collaboration, Google, Google Apps

Easier Paper Grading with Google Classroom

Hurricane Matthew forced TLT to cancel our session on “Easier Paper Grading with Google Classroom.”  We had several people ask if we could reschedule, so to meet the needs of more faculty we decided to do a recorded version of the class.  Check out the playlist to view the entire session, or click on the three lines in the upper right corner to view specific videos in the series.


6 REASONS TO USE GOOGLE SHEETS
Collaboration, Google, Google Apps, instructional technology, Share

6 Reasons You Should Be Using Google Sheets Instead Of Excel

I have always said that if I could only have two applications on my computer it would be Photoshop and Microsoft Excel. With those two applications I can do almost everything I need to do in a day. Lately, however, my eye has drawn to Google Sheets, and I have to say, I love it.

Now some of you may be saying, “Why do I care? I don’t teach accounting.” Well you don’t have to teach accounting to use spreadsheets in your teaching. They are great for collecting text-based information, running statistics and doing calculations, and graphing and analyzing text or data. So now that you are ready to use spreadsheets in your classroom, here are 6 reasons why you should use Google Sheets instead of Excel.

Reason 1: Collaboration

Unlike Excel, Google Sheets is collaborative. All CofC students already have Google accounts so it’s very easy to share a spreadsheet with them or for them to share with one another. When collaboratively editing a sheet each student can see the exact cell that is currently selected all other users, to prevent overwriting. There is also a built-in chat function so students can communicate online while collaborating on a Sheet.

Reason 2: Revision history

Revision History Screenshot
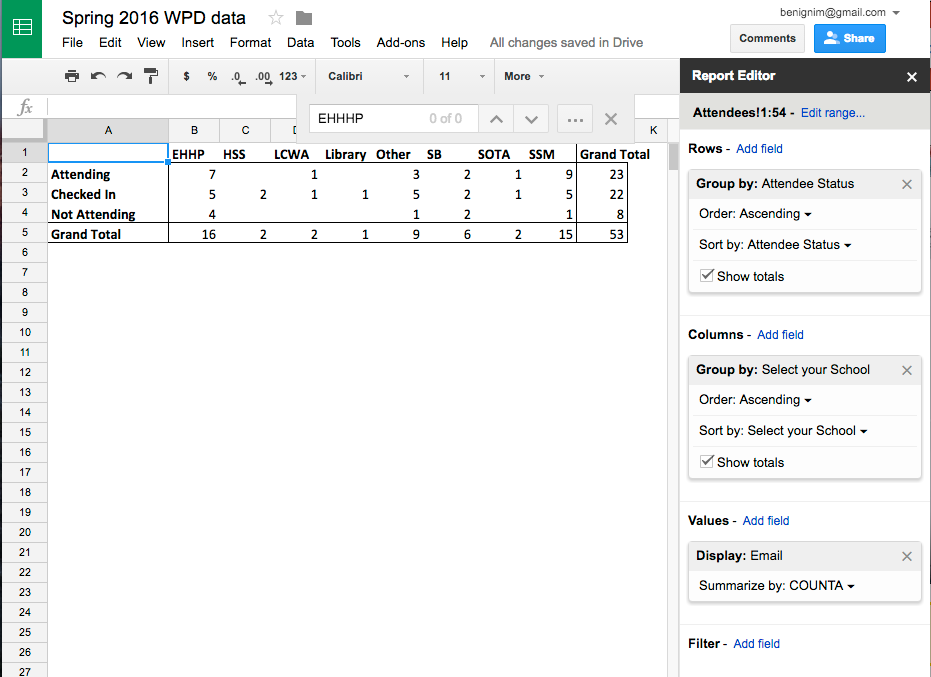
How many times have you heard, “Student X didn’t contribute anything to the project.” Now you can see exactly who contributed what and when using the Revision History. The built-in revision history gives you a timeline of all changes and additions to the spreadsheet, who made each one and when they made it. Just go to File > Revision History to see this record. The best part? This is all automatically recorded. While you can track revisions in Excel, it’s a more manual process and in the end, still leads to multiple versions and things being overwritten.


Reason 3: Sharing

Google Sheets are easy to share. Because they are already online, Sheets can be shared to OAKS or a website, using a link. These links can be set to allow the users to only view the sheet or to edit it. This is particularly handy if you want to post a spreadsheet in OAKS. Just go to Content and select New > Create a Link and paste in the shared link to your Sheet, making the file easy for the students to locate and easy to work on collaboratively as a class. This is something that can’t be done with Excel (Note: I believe this feature is available in Office 365).

Reason 4: The power of Google

From Alice Keeler, “Because of its tight integration with Google, Sheets can import all kinds of data from other Google services and the web at large. You can translate the contents of a cell using the function GOOGLETRANSLATE(), or you can fetch current or historical securities info from Google Finance with the function GOOGLEFINANCE(). And with Sheets IMPORTFEED and IMPORTDATA functions, you can pull information from the internet directly into your spreadsheet.” (Teacher Tech)

Reason 5: Google Forms

When paired with Google Forms it’s an easy way to collect data. Google Forms, also part of Google Drive (a.k.a. G-suite), allows for quick and easy form creation that professors and students can use to collect data. These forms can be completed by anyone, on campus or off, with or without a Google Account, and the data is dumped right into a Google Sheet. This can be used to replace an audience response system in your class, to check for understanding, to conduct peer evaluation, to collect lab data, etc. Once the data is in the spreadsheet, students can work with the data online or export the Sheet to Excel in order to take advantage of Excel’s more powerful functions and data analysis tools.

Reason 6: Explore with Graphs

explore screenshot
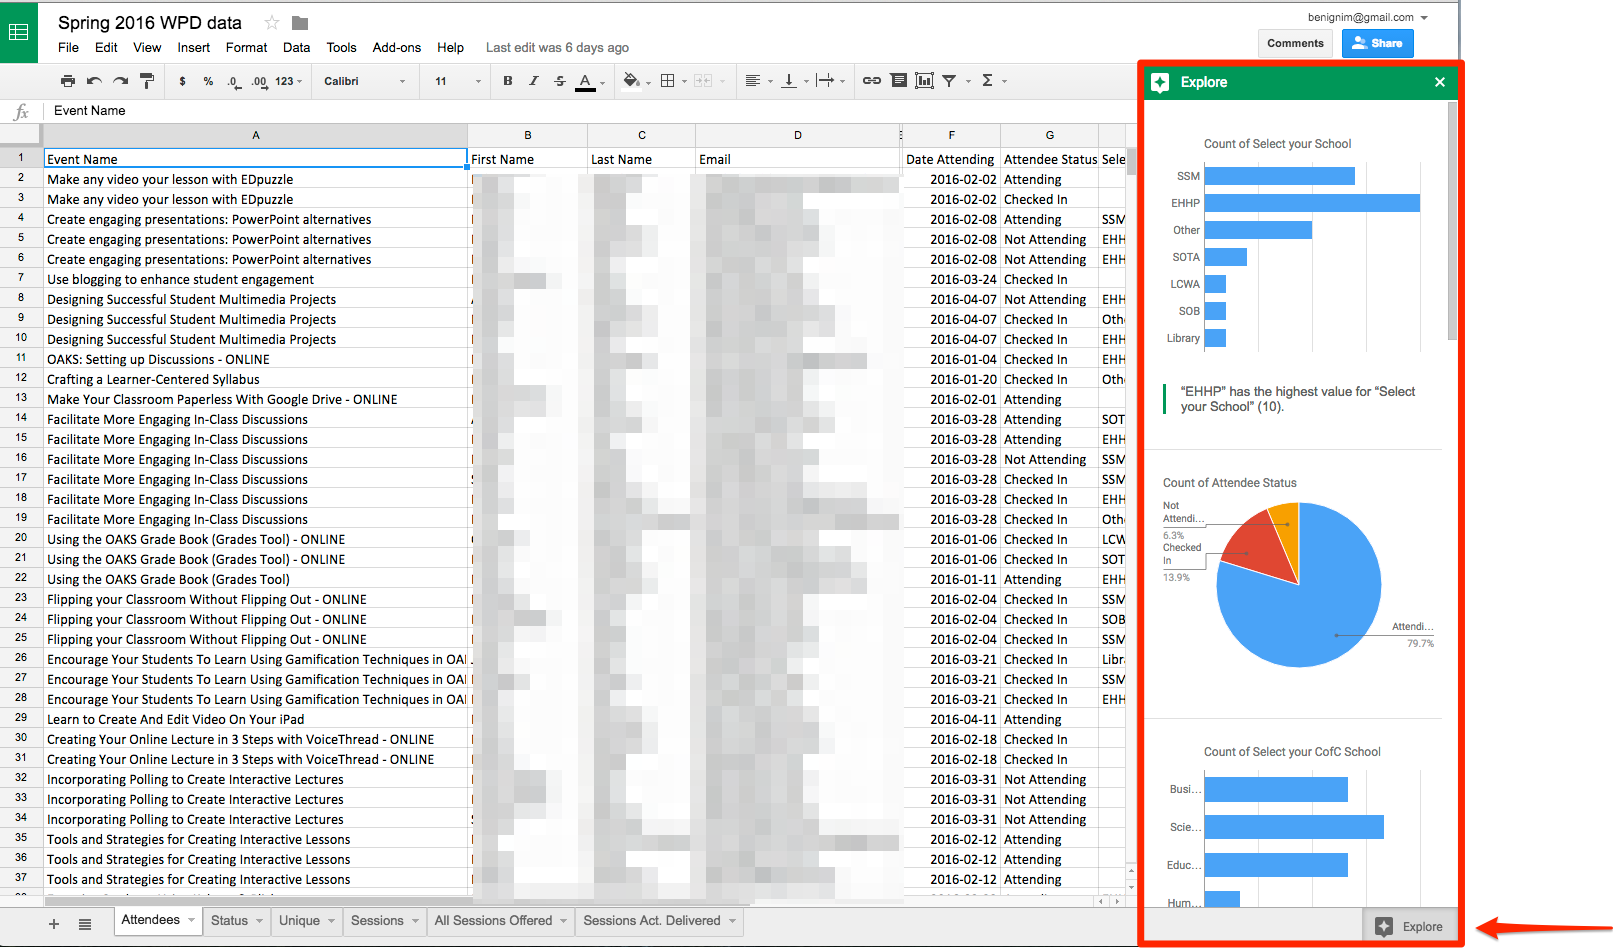
Sheets has a super cool EXPLORE icon in the lower right corner of every spreadsheet. This offers a quick overview of the data in chart format. You can view the entire sheet or just specific rows or columns. It’s a fast way to get a first look at the trends in your data before moving on to your own analysis. Just click on the icon and Google does the rest. Don’t worry, if this doesn’t provide enough analysis you can always create your own graphs, pivot tables, and calculations.  Excel doesn’t have this feature that I can find.


These are just my top 6 reasons to use Google Sheets. I have a ton more. So, can I do everything I did in Excel in Google Sheets? No, I can’t. Excel’s statistical analysis features and functions are still more powerful and probably always will be, but that’s not really what I use spreadsheets for much anymore. Most of the features I used in Excel, like shifting cells, can be done via a Google Add-on, which is a little extension that you can load to increase Sheet’s functionality. Given that, there’s very little need for me to go back to Excel.

Still not sold?

Check out Alicekeeler.com. Alice Keeler is a Google Sheets guru and she always has some amazing cool tricks that you can do with spreadsheets in the classroom. She has written some Add-ons for Sheets that allows you do have more control and automate some processes. Teacher Education folks, you will love her as all of her examples are from her classroom experience.  Check out this one:

Have everyone contribute to their own tab – Give students their own and collaborate. This add-on takes your class roster and automatically creates a spreadsheet tab customized for each student in your class. It can even copy a template to each tab. What a great timesaver!

Small Teaching Tip Number 5 focuses on using Google Docs and Slides to make in-class group work more productive and efficient.
Collaboration, Google, Google Apps, Productivity, Small Teaching Tip, Teaching Advice

Small Teaching Tip #5: Make Group Work More Efficient with Google Apps

Collaboration and project management are important skills for college students to learn.  Unfortunately, many students grumble about group work and faculty spend too much time managing logistics.  Wouldn’t it be nice if there were tools that could make in-class group work more efficient and productive?

I have a possible solution for you!  Google Apps!

All CofC students and faculty have free access to Google Apps for Education using their College email address and password.

Here are two ways you can use Google Docs and Slides to make group work more efficient:

Share Templates

In-class group work is most effective if students are given clear instructions, including the goals of the activity and expectations for a deliverable.  Without purpose or guidelines, students will be less productive and more easily distracted.

One way to provide structure is to create an outline, template, or worksheet to guide students’ work.  If you create this handout in Google Docs, you can easily share it with students who can then type on the document as they work with their teams.

But, Jessica, wouldn’t that mean all students would be typing on the same document?

Yes, unless you make this tiny but powerful change to the document URL: delete the word “edit” from the end of the URL and replace it with the word “copy.”

Sharing clean copies of Google Docs with students

When students click on the URL you’ve shared with them, they will be asked to make a clean copy.  Now, each student or each group can work on their own document.

Ask your students to share their document with you so you can see what they’ve accomplished during class.  And if groups run out of time and need to finish outside of class, every group member can contribute from their own dorm room or apartment (because Google Drive is cloud-based).

Share a Slide Master

After students complete an in-class activity or assignment, do you ask groups to present their work to the rest of the class?  This form of debriefing or “reporting out” encourages students to work harder because they’ll have to stand in front of the room to present to their peers.  It also gives students much-needed opportunities to practice their public speaking skills, which are typically quite weak.

But if you ask students to create slides in Powerpoint, every student would have to email their file or save it to a thumb drive and then open it on the teacher station computer.  This requires too much precious class time.

Instead of using Powerpoint, create an empty slide show in Google Slides.  If you want students to design their own slides, simply create a presentation with blank slides (one slide per student or one slide per group, for example).  If you want students to include certain pieces of information on their slides, create a template.  You can then duplicate that template slide for as many students or groups that you have.

Next, give your students editing rights and share the URL with them (watch the animated GIF below).  Every student can now access that slide deck during class and work on their individual slides.   When it’s time to present to the class, you only have to open the one Google Slides presentation and the entire class’ work is right there!

Changing share settings for a Google Doc


We hope you found this week’s Small Teaching Tip helpful.  This post is part of a series which presents low risk, high reward teaching ideas, inspired by James Lang’s book Small Teaching: Everyday Lessons from the Science of Learning.

6 reasons you should be using Google Slides
Best Practices, Collaboration, Google, Google Apps, Presentation, Productivity, TLT

6 Reasons You Should Be Using Google Slides Instead Of PowerPoint

We all use PowerPoint to create and deliver lectures and for student presentations.  But PPT lacks one major feature…collaboration.   Google Slides, part of our Google Apps for Education, is a PowerPoint-like presentation application that has that collaboration piece, making it more useful in an academic environment.

Here are six reasons you should be using Google Slides instead of PowerPoint.

  1. Consistency — Your presentations look and act the same way on all computers.  Have you ever created a presentation or lecture on your office computer only to have it look or behave differently on the teacher station in the classroom?  With Google Slides, all fonts, images, videos, animations etc. are stored online (in the cloud) so your lectures/presentations will look the same on every computer.
  2. Easy Access — Since both the application and the presentations are saved in Google Drive, it’s easy to access and work on them from any computer or mobile device.   Just log into drive.google.com and you have access to all your presentations, documents and spreadsheets.
  3. Backchannel for Questions — Google Slides has a new Audience Q&A feature which allows your students/audience to ask questions during the presentation.  When activated a web address is automatically added to to the top of each slide allowing the students to ask their questions or make comments.
    screenshot 
  4. Tracking Work in Group Presentations — faculty love group presentations but hate not knowing who did what.  Google Slides has a Revision History section (File > See Revision History) that shows all changes made to the presentation along with who made them.  This is a great way to hold students accountable for a collaborative project.  Because it’s web-based, all students in the group can actively create and edit content within the same presentation at the same time.
  5. Easy Sharing — With one easy trick you can share your lecture presentations so that the students can copy it into their Google Drive and then take notes directly in the presentation Notes area.
    • Open your presentation and click the blue SHARE button
    • Click GET SHAREABLE LINK and click COPY LINK
    • Now paste that link either in OAKS or an email to our students BUT before sending it make one minor change.  At the end of the link change the word edit to copy ex. edit?usp=sharing  /copy?usp=sharing
  6. Efficient In-class Group Work — Create one blank Google Slides presentation and share it with your class.  During the group work each group with create their own slide(s) with their contributions.  At the end of class you have only one file you have to look at and all the groups have access to each other’s contributions.  This also makes it easy to bring the presentation up in class to discuss the group findings.
    screenshot
Google Sheets my fav. 5 tips and tricks
Google, Google Apps, Productivity, Research, TLT

Give Sheets A Chance

I am a huge fan of Microsoft Excel.  It’s my second favorite application, after Photoshop.  However, I’ve been attempting to move all of my work to Google Apps for Education and I felt like Google Sheets was just not as robust a program as Excel.  That being said, I’ve been working with Sheets exclusively for several months now and am finding many things that are making me love it.  Not as much as Excel, but close.

Here are my top 5 coolest things I’ve learned over the past months:

EXPLORE

screenshot of the explore area openNext time you open up a spreadsheet in Google Sheets, notice the little icon in the lower right cornerExplore icon.  If you click it you get a flyout panel called Explore.  This panel gives you a fantastic overview of your data in chart form and allows you to easily add the charts to your document with one simple click.  I loved this and I don’t believe there is an equivalent in Excel.

How can you use this?

If you create a form, in Google Forms, your data will be collected in a Google Sheet.  The charts in Explore give you the overview you need to get started on your data analysis

You can upload any Excel spreadsheet into Google Sheets and it will convert it to Sheets format so you can get this overview on data NOT collected in Google Drive.

PIVOT TABLES

A pivot table is a tool that allows you to summarize and explore data interactively and is particularly useful for large data sets.   I use them primarily to count or average things but they can be used to extract all types of date from sets.   Google Sheets now allows you to easily create these pivot tables.  Here’s an example of a quick table created from the data we looked at above.  This is a simple pivot table but they can be more complicated depending upon your needs.  Just like in Excel, they update in real time, as the data in the Sheet changes.  You can find pivot tables under Data > Pivot Table

screenshot of the pivot tableScreenshot of a more complicated pivot table

ADD AND DELETE CELLS INSTEAD OF ONLY ROWS OR COLUMNS

There are many times that I want to delete or add a few cells in a spreadsheet and have the rest of the spreadsheet shift to accommodate those cells.  In Sheets you can only add or delete and entire row or column which isn’t very helpful.  With the help of an Add-On called Insert and Delete Cells by Karl.kranich.org you now can.  In Sheets go to Add-ons in the menu bar then choose Get add-ons  In the search area, type in Insert and Delete Cells.  Click on Free.  A pop up window will appear so make sure pop-ups are not blocked.  From that window click Allow. 

Screenshot of the menu To add or delete cell(s) just click on the appropriate cell(s) and choose Add-on again.  You will see it in the menu a new option to allow you to shift the cell after adding or deleting. 

How can you use this?

I use this feature all the time.  Here’s an example:  I paste or import data into a spreadsheet and for some reason, one line is offset just one cell.  This happens if there is a wayward space in the paste.  Now I can just select that cell and shift the rest of the columns one cell to the left to line all the data back up.

FINDING UNIQUE AND DUPLICATES

As much as I love Excel I still struggle with filtering duplicates from a dataset.  This is also something that I use all the time.  For instance, for our training stats, I like to see all the individuals that attended TLT training in one year.  For this report, I only want each individual counted once.  For this I use an add-on called Remove Duplicates by ablebits.com.  Just like earlier you can get it from the Add-ons > Get add-ons menu and search for Remove Duplicates.  Once it’s installed you just select the data then choose Remove Duplicates from the Add-ons menu and follow the instructions.  It’s just four easy steps to locating all the unique or duplicate entries in your data and I think it’s 10x easier than the filter feature in Excel.

PREVENT PRINTING, COPYING, AND DOWNLOADING

Screenshot of Advanced SharingDid you know that you can share a spreadsheet with people without giving them the ability to print it, copy it, or download it?  Well you can.  Just open your Sheet and click on the Share button in the upper right corner.  Now click on Advance in the bottom right of the new window.  Make sure your normal settings are set correctly depending upon the level of security you want.  Then at the bottom click on Disable options to download, print, and copy for commenters and viewers.  This actually works surprisingly well, especially with a large spreadsheet.  Could some take a screenshot of the data?  Sure, but the only way to stop that is to not let them see it in the first place.  

How can you use this?

This came to my attention when a faculty member wanted to share a large list of internship options but didn’t want that list to be shared with those outside her class.  Again, while not foolproof, it provides enough of a deterrent to meet the needs.

REMEMBER:  DO NOT STORE ANY STUDENT SENSITIVE INFORMATION ON GOOGLE DRIVE/SHEETS.

I hope these tips will get you to reconsider Google Sheets as a viable alternative to Excel.