

Kate Owens, 02/2016
Back in early February, as part of my ongoing work with the Math & Science Partnership, I led a Saturday professional development workshop for STEM teachers on “Proportion, Decimals, and Percents (oh my!).” There were two major projects we worked on that day. First, I split the teachers into teams of two or three and they read over some “Always, Sometimes, Never” statements. Fawn Nguyen’s blog post has some great ideas to get you started on those. Second, we simulated determining a wildlife population. Since this is something I hadn’t seen blogged about before, I thought I’d tell you about how it worked.
We are simulating a capture-recapture method for determining the population of animals in an ecosystem. pic.twitter.com/FzJkl8gULj
— Kate Owens (@katemath) February 6, 2016
I found the idea for this in a book called “Mathematical Modeling for the Secondary School Curriculum.” It’s based on an article called “Estimating the Size of Wildlife Populations” that appeared in the NCTM’s Mathematics Teacher back in 1981*. Here’s how it works. Suppose you have some closed ecosystem that has a population of animals — maybe a large lake containing a population of a certain species of fish. What if we want to know how many fish are in our lake? Can you think of ways we might approximate the number of fish?
Here are some ideas that might spring to mind:
- If we knew something about the social personality of the fish — for instance, maybe they are really independent and territorial and don’t like hanging out together — then we might know that they prefer to have at least X cubic meters of space to themselves. If we knew how big the lake was, then this could give us a rough count on how many fish there are. Problem: Knowing how big a lake is, in terms of volume, can be tricky. The bottom of the lake might not be flat. The amount of water varies based on temperature and rainfall. And what if we don’t know if our fish are social swimmers or solo swimmers?
- We could rope off (fence off? net off?) a portion of the lake and count how many fish are in our section. If we knew we’d roped off exactly 10% of the lake, maybe we could use this information to estimate the total number of fish. Unfortunately, this is also difficult. First, we don’t know the fish are uniformly distributed around the lake. Maybe we roped off a portion of the lake that’s very rich in food source so we have many more fish than we should. Second, it’s tough to know if we’ve gotten exactly 10% of the lake or not. (How do you measure the volume of a lake, anyway? I’m sure there’s some way to do this, but I have no idea how.)
You may have thought of some other ways, too. Leave them in the comments. Here’s the way proposed in the NCTM article. It’s known as a capture-recapture estimate. Let F represent the number of fish in our lake. First, we capture a large number N of fish and tag them in a way that isn’t harmful; then we toss them back. We wait a while. Once the fish have had a chance to do their fishy things, we go back to the lake. We then capture x fish — some are tagged(T for Tagged), some are not. Assuming the fish are randomly dispersed throughout the lake, we might conclude that the number tagged in our sample is proportional to the number of tagged in the entire lake: N/F = T/x.
For a quick example, suppose we capture and tag 1200 fish. When we return to the lake, we re-capture 200 fish and we find that 30 of them are tagged. Assuming that the number tagged (30) in our sample (200) is roughly proportional to the number tagged in the lake (1200), we conclude that 30/200=1200/F so F=8,000.
What could go wrong? Well, maybe our sample isn’t very indicative of the population. We throw back all of the fish and then take another sample of roughly the same size. If we take several different samples, we can use the additional information from further samples to get a better estimate of the fish population. (I’m not going to go into all of the statistics at work here.)
Modeling the Fish Population
I gave each group of teachers a box. A shoe box would work. Inside each box were about 200 squares of paper. I didn’t count the squares as I put them in, and I didn’t want any two boxes to have precisely the same number. Having ~200 isn’t necessary — you just want enough people can’t do a fast eyeball estimate, but not too many because eventually you’ll want to count them.
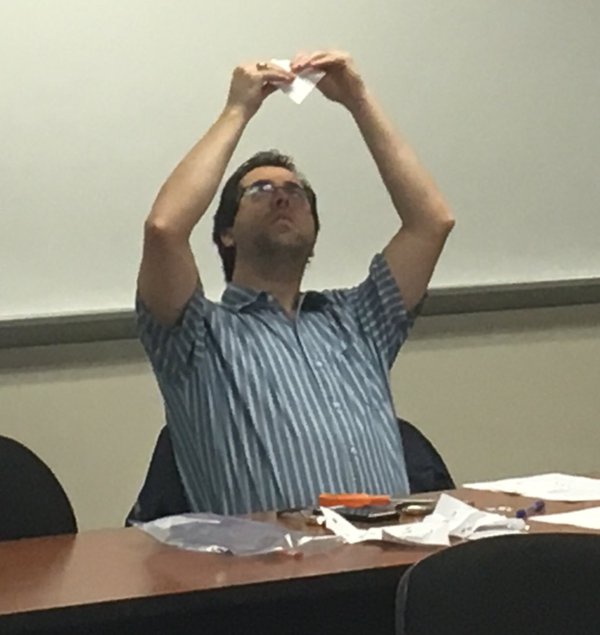
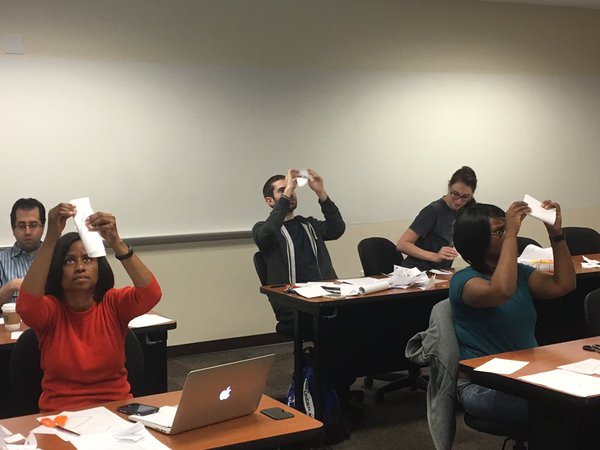
One teacher “went fishing” and “tagged” a handful of fish (a dozen or so)  by marking those squares with a signature, symbol, smiley face, whatever. The fish were returned to the lake before they suffocated. The box was shaken up. Another teacher then took a sample of size larger than the tagged number — something along the lines of 20-25 fish, give or take. The number of tagged fish in each sample was counted. Fish were returned to the pond, the box was shaken, and like it says on your shampoo bottle, “Lather, rinse, repeat.” Assuming the captured sample was the same size, after taking 10 samples, we averaged the number of tagged fish. Using proportions, we found an estimate for the total number of fish in the pond. Lastly, each team counted the actual number of fish in their pond to see how close they were. Most groups were pretty close. As an extension, we discussed how we might modify the method if more than one species of fish were in the pond.
(I saved the boxes. If I do this experiment again, I need to remember to make sure there are lots of squares of paper. Students were easily “fishing” for 30+ fish at a time, and so sometimes they’d end up capturing all their tagged fish.)
The teachers enjoyed this activity & I hope they’ll try something similar with their own students. We had a lot of great conversations about ecology and how our method could be extended, what flaws it might have, and so on!
*Knill, George. “Estimating the Size of Wildlife Populations.” Mathematics Teacher 74 (October 1981): 548′ 571.
 school districts as part of a grant-funded project called “


