The Big Questions

Seeking Help Finding a Needle
A long while ago, I read a great article written by a college history professor. The article was about the professor’s frustrations with the mindset about history that his students had at the beginning of the semester. In particular, he talked about how students would enter his course thinking that the point of history class was to memorize a bunch of related names, dates, places, and battles. But as an academic historian, the professor saw the teaching of history as the re-telling a long narrative about human events, what we’ve accomplished, what our failures were, and how we can try our best to avoid huge tragedies like those we’ve seen in the past.

The professor admitted that throughout the semester, he would remind his students:

“The point of what we’re studying is not that the Battle of Hastings was in 1066AD. We want to focus on the big picture, we want to answer the big questions, we want to tell and reflect on the big story.”

At the end of the semester, the professor added a new question on his final exam: “Tell me something you’ve learned from our class that will stick with you.” –and, of course, the number one most popular response was, “I learned that the Battle of Hastings was in 1066AD.

This is my re-telling of the article. I cannot remember where I read it. I cannot remember who wrote it. I have lost so many of the details. Do you know of this article, professor, or story? I would really appreciate if anyone could point me to where this was published, or by whom.

My Big Picture, Big Questions, Big Story
The reason the above story stuck with me is that I am trying to focus my attention on what I want my students to learn about mathematics, apart from any particular topic or course that I might be teaching. What are the important things I want them to know? What do I want them to know about the discipline of mathematics? What do I want them to know about what it means to think like a mathematician?

Despite feeling like I have a ton of course content to cover (and feeling like I’m always behind schedule), I’m forcing myself to create time in class to address these big ideas. While I absolutely want my students to master the process of integration by parts, in ten years, I really don’t want them to remember our course as “the place I learned integration by parts.”

Instead, I hope my students will remember our course as “the place I got excited about mathematical ideas” or “the place that I learned to be mathematically curious” or “the place I learned to think like a mathematician.”

I don’t know if I’m successful at this goal. It’s going to take a long time to find out, since I have to wait at least ten years. I also don’t know how this is impacting my students today & if I’m making them feel bored, or frustrated, or distracted from the stuff listed in the official Course Description.

Talking Math with My Kids

I’ve gotten so many great ideas from Twitter that I wouldn’t know where to begin describing them all. One of my newest favorite ideas comes from Christopher Danielson and his “Talking Math with Your Kids” project. As he points out,

Parents know that we need to read 20 minutes a day with our kids.

In the same vein, it seems clear that we should make exposing our kids to mathematics a daily goal. At our house, our kids have always been around a lot of conversations about mathematics, but until recently I hadn’t been making a conscious effort to engage with them mathematically. (I have a 3-year-old son and a 1-year-old daughter.) It’s been fun to see where the 3-year-old is in his mathematical development. Here are some things we’ve talked about recently:

  • While buying school supplies: My son’s class required three boxes of tissues and my daughter’s class required two boxes of tissues. I explained this to him. On one hand we held up three fingers and on the other hand we held up two fingers. I asked him, “How many boxes of tissues do we need to buy?” His initial response was, “Three-two!” Then I asked him to count my fingers: “One, two, three, four, FIVE! We need FIVE boxes!” We went on to talk about that three plus two equals five (3+2=5), and then he let me count his fingers and I counted that two plus three equals five (2+3=5) as well.
  • Before watching TV: After picking both kids up from school, we have snack time and the 3-year-old can watch a few minutes of a Mom-approved TV show. (Usually it’s some PBS cartoon; for a long time, his favorite has been Dinosaur Train.) When I asked him how many minutes of Dinosaur Train do you want to watch today? he thought for a long while. I could see he was really trying to think of a very large number. He then excitedly yelled, “TEN!” We clapped and agreed he could watch ten minutes of TV during snack time.
  • On the way to school today: He asked if I was going to go to work today and I told him yes. Then I asked him if he knew I was a teacher, too, just like his teacher at school? After some conversations about whether or not I took a school-bus to my school (I don’t), he asked where my school was and if it was very far away. I told him it was twenty minutes away. Although he can count to twenty, I don’t think he has a sense of what twenty looks like, or how big it really is. He then asked lots of questions about my 20 minute distance:”Is it more than six minutes?” Yes.
    “Is it more than seven minutes?” Yes.
    … “Is it more than eleven minutes???” Yes.

    Then we were at his school and I told him, “It’s even more than nineteen minutes.” He said, “Oooh. So it IS more than six minutes.”

  • Practicing Counting: He’s been learning whole numbers larger than twenty at school recently. We were practicing counting together, and he said: “…twenty-seven, twenty-eight, twenty-nine, twenty-TEN!” We laughed and told him that after twenty-nine comes thirty, and his face let us know this did not make sense and he was not happy. If it goes eight, nine, ten, why does it not go twenty-eight, twenty-nine, twenty-ten? This seems like a really valid concern.

    I used to know a lot more French than I know now. Our conversation made me wonder what he will think in a few years when I can explain to him about soixante-dix (they use sixty-ten for “70”) and even quatre-vingt-dix-sept (four-twenty-ten-seven for “97”).

Combinatorics and Pampers

I’m a mom of a toddler and a newborn, so my house goes through a lot of diapers. We’ve been using Pampers almost exclusively since my son was born in 2010. Pampers offers a program called “Pampers Rewards” where you can enter codes found on Pampers products to their website, and redeem for cool stuff. (Let’s agree to ignore all issues about the effects of disposable diapers on the world ecology, or on family size and the exponentially growing population of humans on our planet, or the obvious questions about why Pampers is trading me stuff for lots of data about how often my kids pee.)

The coding scheme that Pampers uses has bothered me for a while. Each Pampers item comes with an alphanumeric 15-digit code, something like “T9PDXPKKGA3M4GK”. Given that for each character we have 36 possibilities, and the codes are 15 characters long, there are a whopping 3615 such codes. This is about 2.2×10²³. That’s a lot of possible codes! How many? If every single one of the seven billion people (7×10⁹)  on the planet used Pampers, there would be enough possible codes for each person to have one billion codes just for themselves — and then there would still be some left over. While my kids use a lot of diapers, I surely hope we don’t end up needing a billion boxes of Pampers for each of them.

Why does Pampers do this? I am not sure. Instead of an alphanumeric code, why not just use an alphabetical sequence of length 15? This would mean “only” 2615, or a little shy of 1.7×10²¹. In this case, there would still be more than a billion codes available for each one of the seven billion of us.

It’s in Pampers’s interest to make sure only a small percentage of all possible codes are actually connected with a particular product; this prevents fraud on their Rewards program. If I were going to design codes, I’d want to make sure that of all possible codes, maybe only one in a million actually worked. I’ll even be very cautious and allow only one in ten billion (1 in 1010) to actually appear on a product. What is one ten-billionth of 3615? It’s about 2.2×10¹³. This would still leave Pampers with over ten trillion (1013) usable codes. Surely they could find a more efficient coding scheme.

Apart from efficiency, I’d really love it if Pampers would just print the associated QR code along with the actual 15-digits. Having to type in multiple 15-digit codes on my Pampers iPhone app, while chasing a toddler, nursing a newborn, and typing a blog post, is really quite taxing!

Mathematics in Fiction Class Visit

Today I attended a colleague‘s “Mathematics in Fiction” course. This course is designed as a First-Year Seminar course, not necessarily for math majors, and has a large writing component. I was invited to attend the class as a “guest participant” so I could be part of a dialogue on the broader issues about gender & mathematics, and how women are portrayed as mathematicians in works of fiction.

Overall, I really enjoyed the discussion we had. I’m hoping the students continue to ponder the issues and questions that were raised. In our conversation, I realized I wanted to make two distinctions that the students perhaps didn’t see.

Mathematician, Math Professor, and Math Teacher
Several students said they were unsure that there are still problems about gender in mathematics, citing that they had mostly female math teachers in high school. There seems to be a cultural conflation of mathematician, math professor, and math teacher. When I tell people I have had very few female math professors, a common response is, “Well all of my high school math teachers were female.” In my mind, these three titles have different connotations. I don’t consider high school math teachers to be “mathematicians” necessarily. To me, a mathematician is someone with advanced training and who has engaged in mathematical research (and, in most cases, who is continuing to do so). The research component separates math professor from math teacher.

As far as the distinction between “mathematician” and “math professor,” I used to think the overlap between these groups was so large that we might as well call these terms synonyms. But “math professor” is an academic job title — one cannot be a math professor if one isn’t employed. Meanwhile, “mathematician” has something more to do with educational background, training, and hobbies and isn’t job related.

One Question Becomes Two
One student brought up that perhaps the gender imbalance in mathematics has more to do with interest than anything else: Could it be that girls are just less interested in math, and that’s why there are fewer female mathematicians? (I don’t believe this to be true.) Our conversation made me want to point out the following distinction, which I think is important: There is a question of whether women like math less than men like math, and then there is a question of whether women like mathematical careers less than men like mathematical careers. In my mind, these are two very different questions.

My experiences & my gut instinct make me think that the bigger issue is that women are less interested in becoming math professors, not that women are less interested in mathematics. Indeed, there has been a lot of discussion about the so-called “leaky pipeline”: While more and more women are finishing both undergraduate and graduate degrees in mathematics, there seems to be a slow-down when it comes to who is being hired into academic mathematics.

The Pregnant Mathematician Drinks Coffee

In our math department’s faculty lounge, one can often find a liquid-y substance some people refer to as “coffee.” This designation seems questionable to me, so instead I have opted for a Starbucks prepaid card. I don’t drink a lot of coffee, but I do have one cup in the morning.

According to Starbucks, a tall (12 oz) cup of Pike Place Roast contains about 260mg of caffeine. Personally, I prefer the Blonde Roast, but I haven’t found its nutritional data. One of my students inquired at Starbucks and the barista told him that the Blonde Roast contains more caffeine per ounce than the others; apparently, since it is less roasted, less caffeine is lost during the roasting process, leading to more in the final product. I wonder if this is true.

How long does caffeine hang out in your body?

Wikipedia reports that the biological half-life of caffeine in an adult human is around 5 hours. The half-life of a substance is the amount of time required for half of the material present to metabolize. In other words, if the half-life of caffeine in your system is 5 hours and you consume 260mg of caffeine at 8am, then five hours later (at 1pm) we would expect 130mg of caffeine to remain in your system — provided you haven’t consumed any more caffeine since your morning coffee.

The half-life of caffeine in your system is related to lots of factors: Your age, your weight, what medications you’re taking, how well your liver is functioning, and whether or not you’re pregnant.

Maternal Caffeine Consumption & Half-Life
It turns out that if you’re pregnant, the half-life of caffeine increases quite a bit. In other words, it takes your body longer to metabolize caffeine. Today’s quick search yielded these few medical studies that agree about this:

According to Golding’s study, by the 35th week of pregnancy, the half-life of caffeine increase to a high of 18 hours. (For comparison, the Knutti et al. study cites a half-life of 10.5 hours during the last four weeks of pregnancy.) Since I am not yet in my 35th week of pregnancy, let’s assume the half-life of caffeine in my body is 12 hours. How is this different from my (assumed) non-pregnant state, when its half-life is only 5 hours?

Suppose I consume a Pike Roast Tall coffee at 8am that contains 260mg of caffeine. What time will it be when only 50mg of caffeine remain in my system? When not pregnant, it would take my body about 11.9 hours, so by 8pm less than 50mg of caffeine would be found in my system. Meanwhile, a half-life of 12 hours means it would take my body 28.5 hours — that’s over a full day!

We discussed this calculation as part of my PreCalculus course a few semesters ago. One student, who was usually rather quiet and didn’t ask many questions, raised his hand. He asked, “So, Dr. Owens, what you’re telling me is that to save money on Starbucks coffee, I should get pregnant?” Laughter ensued, and I assured my students that getting pregnant as a cost-savings measure was really not an optimal strategy.

As far as the risk to maternal and neonate health, the American Congress of Obstetricians and Gynecologists concluded “Moderate caffeine consumption (less than 200 mg per day) does not appear to be a major contributing factor in miscarriage or preterm birth” in 2010 [1] [2].

My Conclusion: Okay, it’s probably best if I limit my caffeine intake while pregnant. But I also have to think about my overall happiness and my enjoyment of life — as far as caffeine goes, today’s science seems to imply that my occasional Starbucks habit is a net positive (happiness minus risk), even when taking into account its expense (increased work productivity minus $2 per cup).

“The Pregnant Mathematician” Drinks Glucola

Glucose Challenge Screen for Gestational Diabetes
As I posted about a few days ago, this week I had a one-hour glucose challenge test to screen for Gestational Diabetes (GDM). Today I received a phone call from my OB’s office informing me that my results were back and they were within the “normal” levels. Getting a negative result is comforting, but then I went back to hunting for statistical data on what this result really means.

According to an article I found in Obstetrics & Gynaecology, a 1994 study (“Poor sensitivity of the fifty-gram one-hour glucose screening test for hyperglycemia“) by van Turnhout HELotgering FKWallenburg HC reported the sensitivity and specificity of the 1-hour glucose challenge test were 27% and 89%, respectively, with a prevalence rate of 5%.

In statistics, sensitivity and specificity are markers of how good of a test you’re considering. The sensitivity of a test tells you, “Out of all the people who have the condition, what percent of them will test positive?” Similarly, the specificity of a test tells you, “Out of all the people who don’t have the condition, what percent of them will test negative?”

If a test were perfect, we would expect both of these to be 100%. This would mean that 100% of people who have the condition really test positive, and 100% of the people who don’t have the condition really test negative. Of course, in the real world, this never really happens.

What Can I Conclude?
Another way we can gauge the performance of a test is to find its positive predictive value and its negative predictive value. I’m going to assume the sensitivity and specificity in the study cited above are correct. The same study above also gives a positive predictive value of 11% and a negative predictive value of 96%, but what do these numbers mean?

Let’s assume we give the same 1-hour glucose challenge test to 10,000 pregnant women. With a prevalence rate of 5%, we would expect 500 women to have GDM and 9500 not to have GDM. Of the 500 with GDM, since the sensitivity is 27%, we know 27% of 500 would screen positive, for a total of 135 women. These are women who have GDM and whose screening will come back positive. Meanwhile, of the 9500 women without GDM, since the specificity is 89%, we would expect 89% of 9500 or 8455 women to have a true negative result. The status of all of our 10,000 participants is displayed in the table below:

Women with GDM Women without GDM
Women who test positive 135 1045
Women who test negative 365 8455
Total 500 9500

According to this table, a total of 135+1045=1180 women would test positive. Of the women who get a positive result, only 135 of them really have GDM; this is the positive predictive value and, in this case, it’s 135/1180 = 11.44%.

What about the women who, like me, get a negative result? There are 8820 of us, and 8455 of us don’t have GDM. This gives a negative predictive value of 8455/8820 = 95.86%.

Was This Worth $40?
My results were negative, so I am one of the women with a negative result. The values above tell me that since I got a negative result on my glucose screening, I can assume there’s about a 96% chance I don’t have GDM. I’m waiting to be billed for this screening, but I’ll go with my initial $40 estimate. Even after this analysis, I’m still wondering if the knowledge I gained was worth the $40 I paid for it. (“Everything is worth what its purchaser will pay for it,” so I suppose this must be too.)

I feel unqualified to answer the “Worth it?” question because I don’t know a way to quantify the importance of this test. It seems clear that if a condition is really, really awful, then finding out you’ve got it is probably worth $40, and so is finding out you’re home free.

Is GDM really, really awful? It certainly has the potential to affect both my health and the health of my unborn child, so it seems better to know about it than not. But there are lots and lots of things that could affect our health that I don’t know about, and won’t be screened for, and probably won’t ever hear about.

One thing I wish I did have, for this screening and all of the others I have been (or will be) offered, is data ahead of time. I want to know the false positive and false negative rates. I want to know the sensitivity and the specificity and the predictive values. And I want to know how much money it’s going to cost me, and how much of a hassle it’s going to be. Lastly, I would like to know more about the medical significance of the condition, and since I’m not a medical doctor, I need it in some kind of quantifiable metric for when I do these kinds of calculations.

“The Pregnant Mathematician”

I’d like to start by pointing out I know nearly nothing about medicine or obstetrics. I wouldn’t call myself an expert in statistics. I am a mathematician: In my life, what this means is that I was trained to approach problems from a very particular viewpoint. When confronted with choices in my own life, I can’t help but think of them as a math professor would. I would love to find someone trained in obstetrics or medicine to collaborate with on the issues I’ve written about below! Do you know of anyone who would be interested?

“The Pregnant Mathematician”
There isn’t a lot written about what it’s like being a pregnant mathematician. While I would guess that the overlap of these two population groups is small, a better reason might be that it is exhausting to be both a mathematician and pregnant at the same time, and the idea of adding “blogger” to that list seems insane.

Nevertheless, it’s difficult for me to think about having either description without the other. I Tweeted yesterday one of my “daydream goals”:

What would I write about? Well, here’s how my pregnancy has become mathematized over the last couple of months.

Glucola for Breakfast
This morning I was screened for Gestational Diabetes (GDM). This required fasting overnight (nothing but water), arriving at the lab, drinking a very sugary drink, waiting an hour, and having my blood drawn. I’m not exactly sure how much I’ll be billed for this test, but my guess is that it will cost about $40 out-of-pocket.

One of the things I’m always interested in is what the false positive rate for these types of screenings is. In other words, if my doctor phones me in a few days and tells me that my screening test came back positive, what is the chance I really have the underlying condition?

During my hour wait in my doctor’s office, I spent some time trying to find out this answer. According to this New Zealand-based maternity site,

“Approximately 15 – 20% of pregnant women test positive on the [glucose screening] test although only 2 – 5% will have any form of diabetes.”

In other words, if we give the same test I took this morning to 100 pregnant women, we should expect 15-20 of them to have a positive result. However, it will turn out (after further screening) that only 2-5 of them will actually have any form of diabetes. So if my OB tells me that today’s screening has come back positive, then this means I am one of the 20 women with positive results; but only 2-5 of us actually have gestational diabetes. Supposing that 5 of us have the condition, that means 5 out of the 20 positives are true positives.

If my screening this morning comes back positive, there’s around a 5/20 = 25% chance I have any form of diabetes. Looking at this another way, without taking the screening test, my “best guess” of my chance of having GDM is between 3% and 10%, based on the incidence rate for the overall population. So I can feel comfortable that there’s between a 90% and 97% chance that I don’t have GDM. But now I have taken the test; if it comes back positive, this means there’s still a 75% chance that I don’t have GDM.

Basically, I think I just paid $40 to find out if my risk is 10%, or if it’s really higher and is 25%.

How valuable is this knowledge? Is it worth fasting overnight? Is it worth taking time off from work to sit in the waiting room for an hour? Is it worth the $40 I’ll be billed? I don’t know. I never know the answers to these questions, but it seems I always choose to follow my OB’s advice anyway — her practice suggests screening of 100% of their maternity patients, so I just trusted their expertise.

Due Date Calculation
One of the things people always ask when they find out you’re pregnant is, “When are you due?” My obstetrician has some date written down on my medical records, labeled EDD (“Expected Date of Delivery”), that will happen this summer. The basic way the EDD is calculated is using Naegele’s Rule: Take the day of your last menstrual period (LMP), add one year, subtract three months, and add seven days. Example: If LMP date was in January this year (say, January 18th, 2013), adding one year gives 1/18/2014, subtracting 3-months gives 10/18/2013, and adding seven days gives a final EDD of October 25, 2013. There are lots of online calculators that will perform this calculation for you, like this one. This calculation gives 280 days post LMP for an estimated delivery date. But how accurate is that?

Suppose we take forty weeks (280 days) as the mean length of human pregnancies, measured from LMP to delivery date. It seems reasonable to expect that even if your actual delivery date isn’t your EDD, at least it’ll probably be in the same 7-day window. Unfortunately, this isn’t true either. Not only is it not very likely for you to deliver on your EDD, but it isn’t very likely you’ll deliver that week.

A study done in Norway (Duration of human singleton pregnancy—a population-based study, Bergsjφ P, Denman DW, Hoffman HJ, Meirik O.) involving 427,582 singleton pregnancies found a mean gestation length of 281 days, with a standard deviation of 13 days. By the empirical rule, this means more than 30% of women won’t give birth in the 26-days surrounding their EDD!

Example: Your EDD is June 15th. According to the study cited above, there’s more than a 30% chance that your real delivery day will be either before June 2nd or after June 28th. There’s a very real possibility you won’t even give birth in the month of June. (After talking about this with a few colleagues, one of them found a Statistics book that cited a standard deviation of 16 days!)

Here’s a great article about this same topic: http://spacefem.com/pregnant/charts/duedate0.php

Nuchal Translucency Screening
One non-invasive genetic screening test offered to all pregnant women in the United States is the nuchal translucency screening (“NT screening”). This screening is done in the first trimester (between weeks 11 and 14) and involves an ultrasound and a blood test. It screens for Down Syndrome (trisomy 21) and other chromosomal abnormalities caused by extra copies of chromosomes. The ultrasound image is read by measuring the width of the nuchal fold, found at the base of the neck. If the measurement is outside of the normal range, further testing is indicated. The cost of the test varies widely, but is somewhere in the neighborhood of $200.

The risk of carrying a baby with chromosomal abnormalities increases with maternal age. This page has a large table of the risk of Down Syndrome (and other trisomy abnormalities) as a function of maternal age. I’ll use a maternal age of 29, which carries with it a risk factor of 1 in 1000 for Down Syndrome. This means that out of 1000 moms (all age 29), one will have an affected baby.

One of the problems with the NT screening is the false positive risk. This would happen if your test comes back positive, when in fact you do not have the condition. In other words, this is the “false alarm” risk. According to my OB, the false positive rate for the NT scan is 5%.

Let’s go back and talk about our 1000 women (all pregnant and age 29, with no other risk factors). If we screen all of these women, then a 5% false positive rate means that 5% of them will have a positive test but whose babies do not have Down Syndrome. So that’s 50 women who will get a “false alarm” from this test. Also, one woman will have a true positive: She’ll get a positive test and her baby will have the condition. Altogether, out of the 1000 women, 51 of them will get a positive test. And out of these 51 women, only 1 will have an affected baby. The other 50 women will undergo lots of unnecessary worry.

I was offered the NT screening during the early portion of my pregnancy. Given my age, my child’s risk of Down Syndrome was around 1%. I was given the option to pay $200 to have the screening. If it came back negative, then I’d be worry free. If it came back positive, this would mean my child’s risk is about 1/50 or 2%.

In other words, without taking the screening, there was a 99% chance my child does not have Down Syndrome. Or, if I wanted, I could pay $200 for a test that, if positive, still means there’s a 98% chance my child does not have Down Syndrome. Is this test worth $200 to me?

As with the GDM screening, I followed my OB’s advice and had the nuchal translucency test a few months ago. The results were normal, which was comforting. The bill was around $250.

It’s tough having to juggle my emotions as a mother, my knowledge of statistics as a mathematician, and my interest in minimizing unnecessary financial expenses.

Even More Weather Data

I’ve had fun over the last few days chatting with colleagues, friends, and family about the March-related weather in Charleston. See my previous blog posts to find out the background of this information. Here I’ll outline two new developments that came up today. Again, all of this pertains only to the month of March and only in Charleston SC.

(1) When do we ever use calculus, anyway?

In an e-mail yesterday, Dan Jarratt remarked that he was surprised by the result that the today-to-tomorrow temperature change had an average (mean) of +0.037 degrees Fahrenheit. In other words, given today’s high temperature, on average we expect it’ll be about 0.04 degrees warmer tomorrow. This isn’t a very big difference, as Dan remarked; it was lower than he thought it would be. This made me wonder if I too thought this was a small temperature change.

I would guess that the hottest month in Charleston is August. (That is, August is the month that has the highest average temperature.) Also, I would guess that the coldest month is six months from August, so that would mean February. Assuming that the temperature shifts in a sinusoidal fashion, we’d get a nice sine function with a period of 12 months; a local maximum in August; and a local minimum in February. This led to the following question, which I asked my Calculus students today:

When is the temperature in Charleston increasing most rapidly?

First, we had some discussion on how we could rephrase this question into one about calculus. If the temperature is increasing most rapidly, that would mean that the slope of the tangent line is its largest; this would occur halfway between February and August. We agreed that this would be the month of May. Let T(x) be the temperature at time x. Graphically, if the temperature is increasing the most rapidly, then this is where T'(x) has a local maximum, so T”(x) changes sign from positive to negative. In calculus, we call this a point of inflection: a place on the graph where the tangent line increases most rapidly (should such a place exist). Alternatively, it is where the graph changes concavity — in this case, from being concave up to concave down.

(2) What would a numerical simulation tell us?
Both my College of Charleston colleague Jason Howell and Dartmouth professor François G. Dorais suggested my predictive model wasn’t great, and

Thankfully, Jason was willing to help write some code toward this goal. (His code is given below, written for MATLAB, in case you’re interested!) He gathered historical averages for high temperatures for each date in Charleston, restricted to the month of March, from weather.com. The averages were computed using data from 1893 through 2013. Given that the average temperature change was +0.037F and the standard deviation of this temperature change was 8.39, we can run a number of trials to answer the question

How many days in March can we expect to be at or below their historical average temperature?

Jason’s code simulated one million different March months, given a starting temperature on March 1st of 68 degrees F. Here’s a histogram of results:

resultsOf course, March 2013 hasn’t finished quite yet. But this histogram does tell us that if we end up with 23 or 24 days with an “at or below average” temperature, this isn’t exceedingly rare — or it isn’t as uncommon as I had thought it would be.

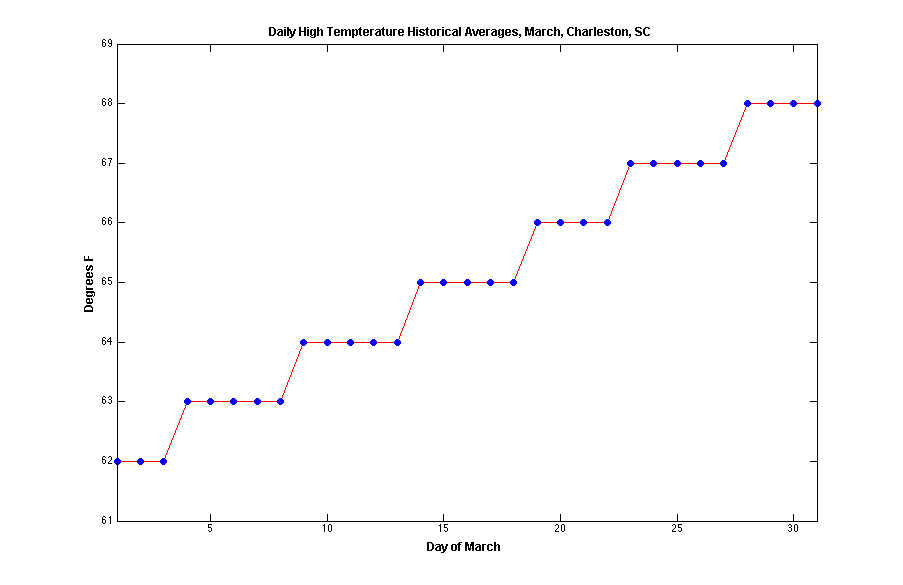
Here’s a graph of the daily average temperatures (based on the same historical data):

historical

Jason’s Code:

function y=weatherexp(start_temp, num_trials)

%set historical averages, from weather.com
hist_avgs = [62 62 62 63 63 63 63 63 64 64 64 64 64 …
65 65 65 65 65 66 66 66 66 67 67 67 67 67 68 …
68 68 68];
%initialization
num_days=length(hist_avgs);
temp_diff = zeros(size(hist_avgs));
num_days_below = zeros(1,num_trials);
%parameters for normally distributed daily temperature changes
%from months of March from 1893 to 2012
stdev = 8.39;
avg = 0.037;
%loop over trials
for j=1:num_trials
%set temperature for start of a simulated month/week/etc.
curr_temp = start_temp;
for i=1:num_days
%get temperature change
temp_change = avg+stdev*randn(1,1);
%new temp
curr_temp = curr_temp + temp_change;
%how far from average?
temp_diff(i) = curr_temp – hist_avgs(i);
end
%count number of days below average
num_days_below(j)=sum(temp_diff<0);
%temp_diff
end
%histogram of the num_days_below data
figure
hist(num_days_below,[0:31])
y = num_days_below;

More Weather Data

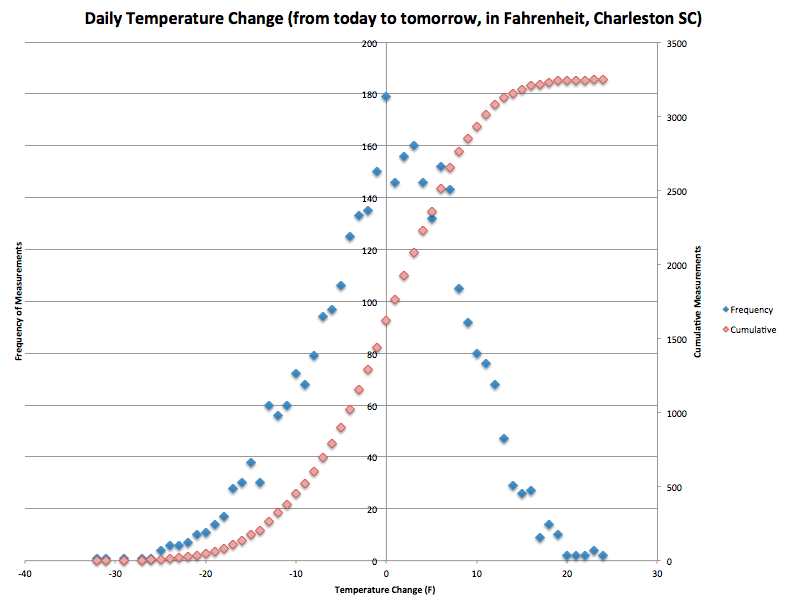
Dan Jarratt just e-mailed me a graph displaying the temperature difference from today until tomorrow, where we focus our attention only on Charleston SC in the month of March over years 1893-2013. Here are the summary statistics:

  • n = 3250 day-to-day changes, measured only when dates are in 3/1 to 3/27 over years 1893 to 2013
  • Mean = +0.037F, median = +1F
  • Standard deviation = 8.39F

daily-temp-changes


What is this graph telling us?

  1. In the month of March, on average it’s going to be 0.037 degrees (F) warmer tomorrow than it is today.
  2. But half the time, the temperature increases by over 1 degree (F).
  3. The temperature jumps are roughly normally distributed.
  4. The cumulative percentile jump of 0 degrees (F) is 49.85%.
  5. Graphs are neat.

Probability and Weather

Warning: I know very little about probability. I know even less about weather phenomena! The post below describes something I was thinking about today, because I find it interesting and I’m procrastinating when I should be grading a giant pile of calculus exams instead!

The following image appeared on my Twitter feed, courtesy of @LCWxDave:

This made me wonder, “What is the probability that at least 21 of the last 27 day’s highs have been at or below average?

First, let’s make two (probably bad) assumptions: (1) High temperatures are normally distributed, and (2) the events “Today’s high temp” and “tomorrow’s high temp” are independent. If this is the case, then the probability requested above is

(27!/(21!6!)+27!/(22!5!)+27!/(23!4!)+27!/(24!3!)+27!/(25!2!)+27!/(26!1!)+27!/27!)*(0.5^(27)) = 0.0029623

or about three-tenths of one percent. This struck me as being exceedingly rare! Then Dan Jarratt pointed out,

It puzzled me that my computed probability was 0.3% but the actual collected data suggest happened 8% of the time! What’s going on?

First, I still have no idea about my assumption about temperatures and normal distributions. Second, I really ought to do a more careful calculation and not treat each day’s high temperature as independent from the next day’s high. Surely, if it’s very cold on Wednesday, it is probably pretty likely it’s going to be cold on Thursday, too.

So instead of treating the 27 days as 27 different events, let’s consider them as 13 two-day events. Out of these 13 two-day events, about 10 of the two-day events have been colder than average. New question: “What is the probability that at least 10 of the last 13 two-day’s highs have been at or below average?

In this case, the computation yields

(13!/(10!3!)+13!/(11!2!)+13!/(12!1!)+13!/(13!))*(0.5)^(13) = 0.046142578125

So my computed probability is 4.6% with the data suggesting 8%. The comparison between these two seems far more reasonable. What this tells me is that today’s weather seems quite dependent on yesterday’s weather, which isn’t surprising. After discussing this with my colleague Garrett Mitchener, he pointed out that a great way to predict tomorrow’s weather is to say that it will be exactly like today. Hopefully, we are better mathematicians than weather predictors.