Even More Weather Data

I’ve had fun over the last few days chatting with colleagues, friends, and family about the March-related weather in Charleston. See my previous blog posts to find out the background of this information. Here I’ll outline two new developments that came up today. Again, all of this pertains only to the month of March and only in Charleston SC.

(1) When do we ever use calculus, anyway?

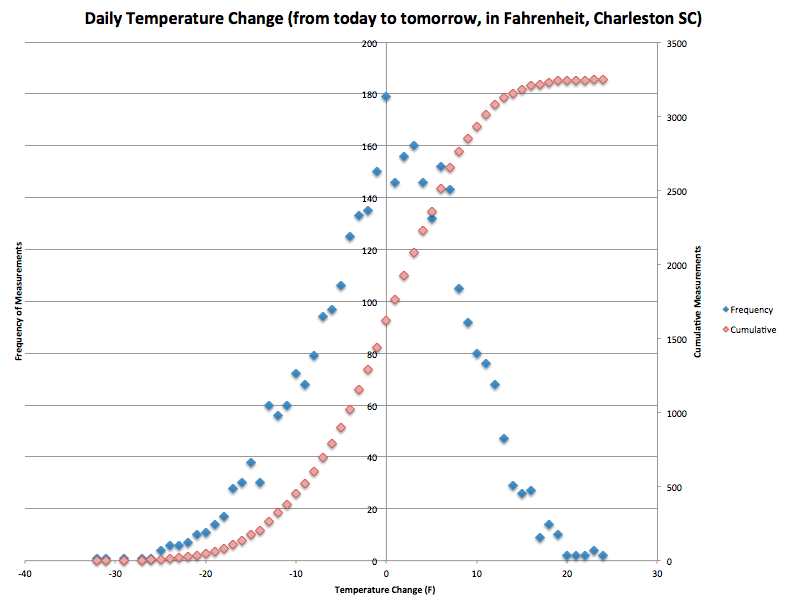
In an e-mail yesterday, Dan Jarratt remarked that he was surprised by the result that the today-to-tomorrow temperature change had an average (mean) of +0.037 degrees Fahrenheit. In other words, given today’s high temperature, on average we expect it’ll be about 0.04 degrees warmer tomorrow. This isn’t a very big difference, as Dan remarked; it was lower than he thought it would be. This made me wonder if I too thought this was a small temperature change.

I would guess that the hottest month in Charleston is August. (That is, August is the month that has the highest average temperature.) Also, I would guess that the coldest month is six months from August, so that would mean February. Assuming that the temperature shifts in a sinusoidal fashion, we’d get a nice sine function with a period of 12 months; a local maximum in August; and a local minimum in February. This led to the following question, which I asked my Calculus students today:

When is the temperature in Charleston increasing most rapidly?

First, we had some discussion on how we could rephrase this question into one about calculus. If the temperature is increasing most rapidly, that would mean that the slope of the tangent line is its largest; this would occur halfway between February and August. We agreed that this would be the month of May. Let T(x) be the temperature at time x. Graphically, if the temperature is increasing the most rapidly, then this is where T'(x) has a local maximum, so T”(x) changes sign from positive to negative. In calculus, we call this a point of inflection: a place on the graph where the tangent line increases most rapidly (should such a place exist). Alternatively, it is where the graph changes concavity — in this case, from being concave up to concave down.

(2) What would a numerical simulation tell us?
Both my College of Charleston colleague Jason Howell and Dartmouth professor François G. Dorais suggested my predictive model wasn’t great, and

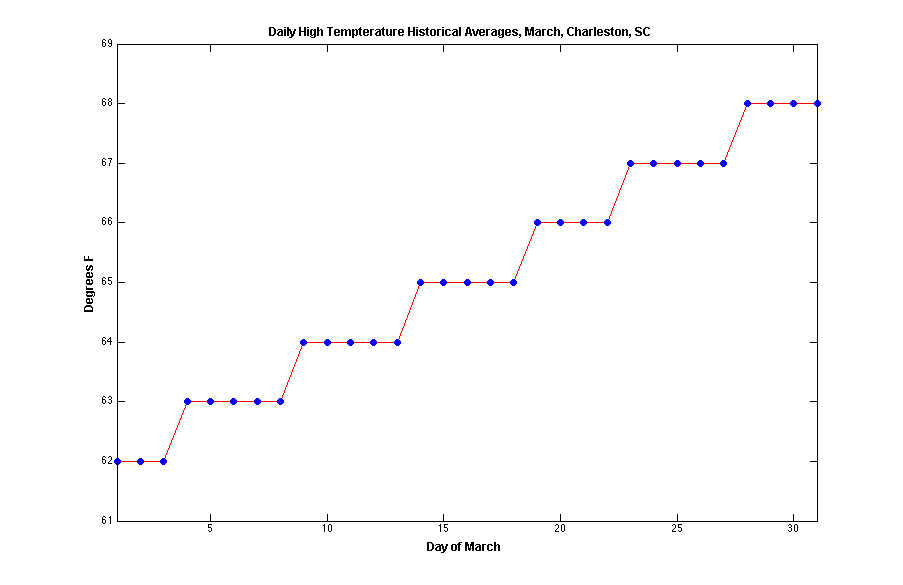
Thankfully, Jason was willing to help write some code toward this goal. (His code is given below, written for MATLAB, in case you’re interested!) He gathered historical averages for high temperatures for each date in Charleston, restricted to the month of March, from weather.com. The averages were computed using data from 1893 through 2013. Given that the average temperature change was +0.037F and the standard deviation of this temperature change was 8.39, we can run a number of trials to answer the question

How many days in March can we expect to be at or below their historical average temperature?

Jason’s code simulated one million different March months, given a starting temperature on March 1st of 68 degrees F. Here’s a histogram of results:

results
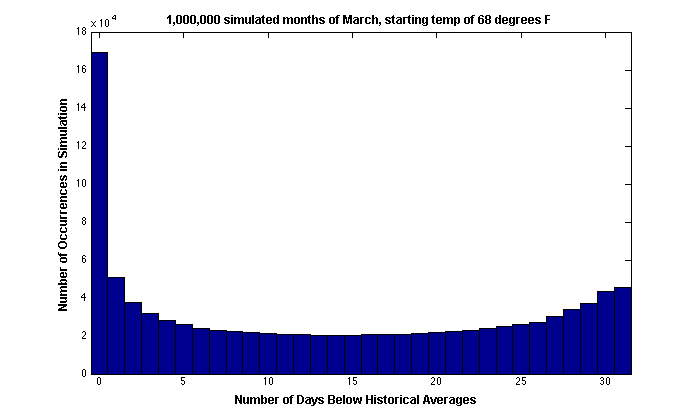
Of course, March 2013 hasn’t finished quite yet. But this histogram does tell us that if we end up with 23 or 24 days with an “at or below average” temperature, this isn’t exceedingly rare — or it isn’t as uncommon as I had thought it would be.

Here’s a graph of the daily average temperatures (based on the same historical data):

historical

Jason’s Code:

function y=weatherexp(start_temp, num_trials)

%set historical averages, from weather.com
hist_avgs = [62 62 62 63 63 63 63 63 64 64 64 64 64 …
65 65 65 65 65 66 66 66 66 67 67 67 67 67 68 …
68 68 68];
%initialization
num_days=length(hist_avgs);
temp_diff = zeros(size(hist_avgs));
num_days_below = zeros(1,num_trials);
%parameters for normally distributed daily temperature changes
%from months of March from 1893 to 2012
stdev = 8.39;
avg = 0.037;
%loop over trials
for j=1:num_trials
%set temperature for start of a simulated month/week/etc.
curr_temp = start_temp;
for i=1:num_days
%get temperature change
temp_change = avg+stdev*randn(1,1);
%new temp
curr_temp = curr_temp + temp_change;
%how far from average?
temp_diff(i) = curr_temp – hist_avgs(i);
end
%count number of days below average
num_days_below(j)=sum(temp_diff<0);
%temp_diff
end
%histogram of the num_days_below data
figure
hist(num_days_below,[0:31])
y = num_days_below;

More Weather Data

Dan Jarratt just e-mailed me a graph displaying the temperature difference from today until tomorrow, where we focus our attention only on Charleston SC in the month of March over years 1893-2013. Here are the summary statistics:

  • n = 3250 day-to-day changes, measured only when dates are in 3/1 to 3/27 over years 1893 to 2013
  • Mean = +0.037F, median = +1F
  • Standard deviation = 8.39F

daily-temp-changes


What is this graph telling us?

  1. In the month of March, on average it’s going to be 0.037 degrees (F) warmer tomorrow than it is today.
  2. But half the time, the temperature increases by over 1 degree (F).
  3. The temperature jumps are roughly normally distributed.
  4. The cumulative percentile jump of 0 degrees (F) is 49.85%.
  5. Graphs are neat.

Probability and Weather

Warning: I know very little about probability. I know even less about weather phenomena! The post below describes something I was thinking about today, because I find it interesting and I’m procrastinating when I should be grading a giant pile of calculus exams instead!

The following image appeared on my Twitter feed, courtesy of @LCWxDave:

This made me wonder, “What is the probability that at least 21 of the last 27 day’s highs have been at or below average?

First, let’s make two (probably bad) assumptions: (1) High temperatures are normally distributed, and (2) the events “Today’s high temp” and “tomorrow’s high temp” are independent. If this is the case, then the probability requested above is

(27!/(21!6!)+27!/(22!5!)+27!/(23!4!)+27!/(24!3!)+27!/(25!2!)+27!/(26!1!)+27!/27!)*(0.5^(27)) = 0.0029623

or about three-tenths of one percent. This struck me as being exceedingly rare! Then Dan Jarratt pointed out,

It puzzled me that my computed probability was 0.3% but the actual collected data suggest happened 8% of the time! What’s going on?

First, I still have no idea about my assumption about temperatures and normal distributions. Second, I really ought to do a more careful calculation and not treat each day’s high temperature as independent from the next day’s high. Surely, if it’s very cold on Wednesday, it is probably pretty likely it’s going to be cold on Thursday, too.

So instead of treating the 27 days as 27 different events, let’s consider them as 13 two-day events. Out of these 13 two-day events, about 10 of the two-day events have been colder than average. New question: “What is the probability that at least 10 of the last 13 two-day’s highs have been at or below average?

In this case, the computation yields

(13!/(10!3!)+13!/(11!2!)+13!/(12!1!)+13!/(13!))*(0.5)^(13) = 0.046142578125

So my computed probability is 4.6% with the data suggesting 8%. The comparison between these two seems far more reasonable. What this tells me is that today’s weather seems quite dependent on yesterday’s weather, which isn’t surprising. After discussing this with my colleague Garrett Mitchener, he pointed out that a great way to predict tomorrow’s weather is to say that it will be exactly like today. Hopefully, we are better mathematicians than weather predictors.

Digital Plan for Digital Action

It turns out that several people had some great suggestions about my wish for digital exam grading. I’ve decided to attempt it for my next Calculus exam, scheduled for Tuesday, March 26th. Here’s an outline of the plan:

  1. Photocopy exams single-sided and unstapled. Place a copy of each exam into an empty file folder.
  2. Subject unsuspecting Calculus students to grueling exam on these topics: Related Rates; Linear Approximation; Mean Value Theorem; Derivatives and Graphs.
  3. Alphabetize exams as they are turned in according to course roster. For absent students, place blank exam where theirs should be.
  4. Use department copy machine to scan all ~350 pages to a single PDF file and send it to me via e-mail.
  5. Thank my husband profusely for writing pdftk bash script that will take the single PDF file and break it apart, at every ~9th page, and rename the files according to last name (keeping alphabetical order in place). If this works, I should end up with 36 PDF files where each student has a file called “Owens-Calculus-Exam3.pdf” or something similar.
  6. Create Dropbox folders for the ungraded exam PDFs and the graded exam PDFs. Use GoodNotes to grade the exams on my iPad. Export the finished product back to Dropbox.
  7. Disseminate graded exams and grades to students.

It’s likely my first attempt at this will take longer than nondigital grading. One of the things I will have to do as I go is come up with “Correction JPGs” for those errors that happen most frequently and store them somewhere on Dropbox. I think these should be easy to add to each exam using the “import JPG” feature of GoodNotes. Usually I estimate that grading will take no longer than 10 minutes per exam. For my 36 calculus students, this means regular grading should take me about six hours. Hopefully this digital grading effort won’t take too much longer than this.

For Step 7, I also need to find out about FERPA. Provided I have a “sign for consent” on my exam header page, is that enough for it to be okay for me to e-mail each student her graded exam? Alternatively, is there a way using our Desire2Learn-Dropbox (on our Learning Management System) to return the exams to the students in some easy way?

Wish me luck!

Want Some Free Red Pens?

I’m about 75% through this round of midterm exam grading. Overall, I’m down to around 100 students in total, over three classes. I’ll give four midterm exams and a final exam at the end of the semester. This requires a lot of red ink.

A while ago, I read an inspiring article in the MAA FOCUS called “Abandon the Red Pen!” written by Maria H. Andersen. The article was about digital grading. Since I read it, digital grading has been a dream of mine. Ideally, here’s what I’d like to do with the pile of exams currently sitting on my dining room table:

  1. Students take exams in class, on paper, like usual.
  2. After students turn in exams, magic happens. I end up having a PDF file of each individual exam paper, titled something like “StudentLastName-Calculus-Exam2.pdf”
  3. I dump all of the PDF files into a Dropbox folder and then I do all of the exam grading on my iPad.
  4. Once I’m done, I save each file as “StudentLastName-Calculus-Exam2Graded.pdf” and then more magic happens, and each student gains access to their graded exam — perhaps over e-mail, or through the file server in our Learning Management System, or some other solution.

Overlooking the requisite magic requirements, let me explain why I’d prefer this to offline grading:

  • I wouldn’t have to carry 100 exams home, keep them away from my toddler, make sure I don’t lose any to black hole of my desk, try to avoid spilling coffee on them, etc.
  • I would have a complete digital record of a student’s work. Occasionally a student comes to me at the end of the course and says, “I just checked the online gradebook. It says I earned grade X%, but I am certain I earned grade (X+4)%.” Sometimes they are able to produce the test paper and the gradebook indeed has an error. Sometimes they aren’t able to produce the test paper, and I can’t do anything for the student. Having a digital PDF file of every graded exam would solve this issue immediately.
  • In the unfortunate case of dishonest work, I would have a clear record. (For instance, if a student modifies their test paper after it is graded and returned, and then asks for more credit on a problem. This has happened in the past.)

But the most important reason I’d love to switch to digital exam grading is that I could give better comments in less time. On the current test, all students had to solve a similar “Optimization” problem involving having a constrained amount of fencing to build a backyard of area A. For the most part, students fell into one of three categories: (A) Response entirely correct; (B) Response entirely incorrect or missing or blank; or (C) Response partially correct, but some errors were made. In category (C), there were only about three types of errors: That is, everyone who made a mistake made one of the same three mistakes.

Digital grading would allow me to type up a full response as to what the error was, why it was not correct, and how to fix it. I would only have to type the response once. I could save it as a JPG file. Then whenever a student made that particular error, I could just “drag and drop” the response onto their test paper.

Also, eventually I’d have JPG stamps for the big “Top 100 Algebra Errors”, things like sqrt(9+16) is not the same as sqrt(9)+sqrt(16). I would never have to write anything about this mistake again because I could just drag and drop the explanation JPG!

Now, the tricky part: How do I get the magic to happen? The photocopy machine in my department is quite happy to take 8 pages, scan them to a PDF, and e-mail them to me. So, for a particular student’s exam, I could undo the staple, run it through the copy machine, and I’d be done. Unfortunately, I don’t know how to do this en masse very efficiently.

Suppose I have 100 exam papers, each 8-10 pages. How do I remove all of the staples, run each one through the copy machine individually, and rename the files? This process seems very easy, but I estimate it would take about a minute per exam. At this point, I’d rather spend 100 minutes doing the grading than 100 minutes dealing with the paper shuffle. Hence I need magical elves. Or graduate students.

Since I haven’t figured out how to do this first step, I haven’t given much thought as to how to “hand back” the graded files. I’m sure there’s probably some easy way to do this in our LMS, so maybe it wouldn’t even require magic.

Do you have any ideas about how to do the first step (i.e., scan each individual exam paper to PDF) that doesn’t require magic, graduate students, or administrative assistants? I’m happy to send you all my red pens in trade for such information.